Mongolian vs Latvian No Schooling Completed
COMPARE
Mongolian
Latvian
No Schooling Completed
No Schooling Completed Comparison
Mongolians
Latvians
2.1%
NO SCHOOLING COMPLETED
40.8/ 100
METRIC RATING
185th/ 347
METRIC RANK
1.5%
NO SCHOOLING COMPLETED
100.0/ 100
METRIC RATING
34th/ 347
METRIC RANK
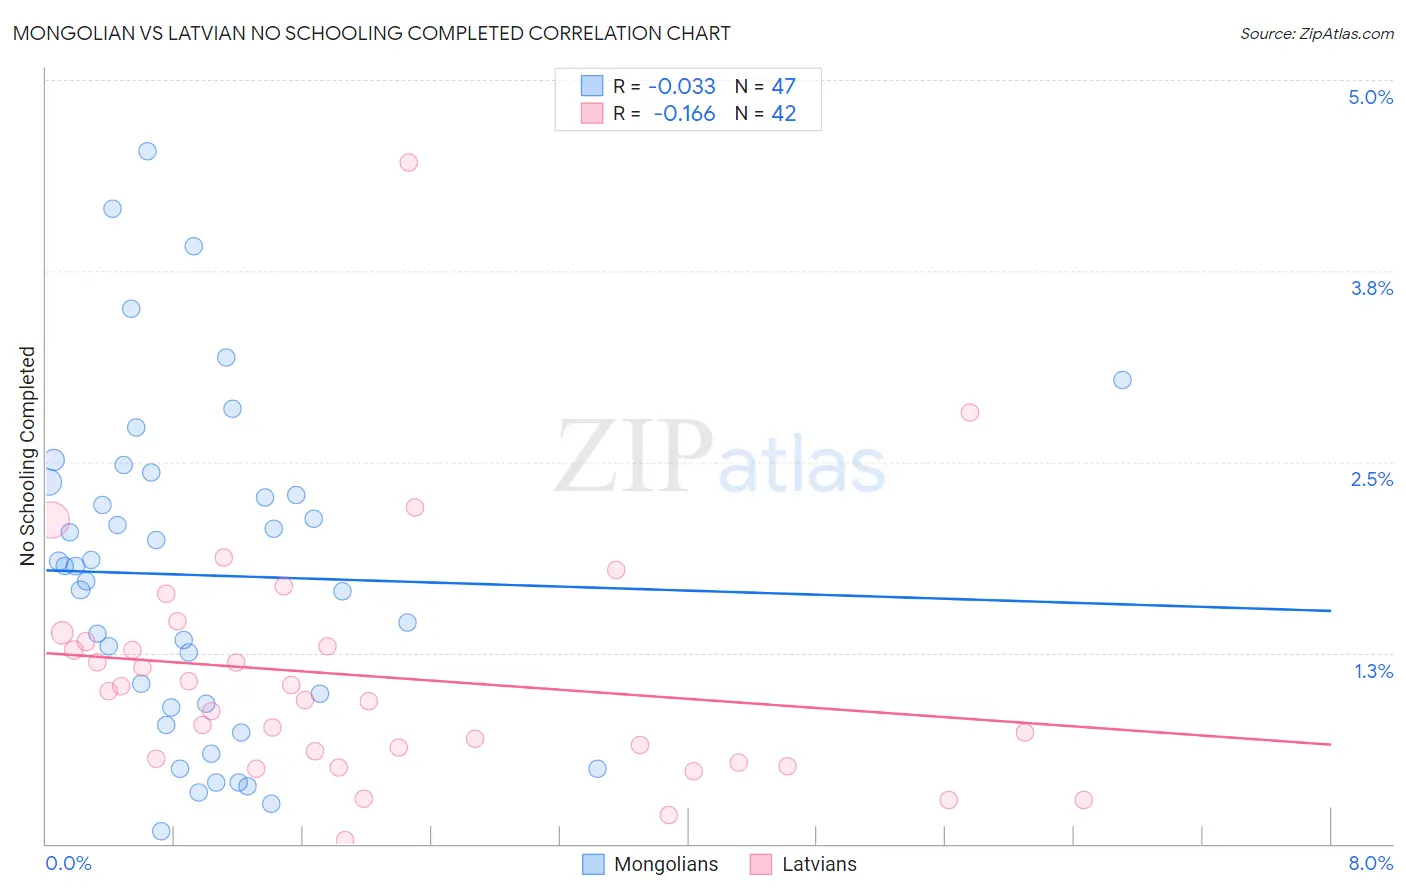
Mongolian vs Latvian No Schooling Completed Correlation Chart
The statistical analysis conducted on geographies consisting of 139,824,247 people shows no correlation between the proportion of Mongolians and percentage of population with no schooling in the United States with a correlation coefficient (R) of -0.033 and weighted average of 2.1%. Similarly, the statistical analysis conducted on geographies consisting of 219,073,605 people shows a poor negative correlation between the proportion of Latvians and percentage of population with no schooling in the United States with a correlation coefficient (R) of -0.166 and weighted average of 1.5%, a difference of 37.3%.
No Schooling Completed Correlation Summary
| Measurement | Mongolian | Latvian |
| Minimum | 0.080% | 0.028% |
| Maximum | 4.5% | 4.5% |
| Range | 4.5% | 4.4% |
| Mean | 1.8% | 1.1% |
| Median | 1.8% | 0.97% |
| Interquartile 25% (IQ1) | 0.89% | 0.56% |
| Interquartile 75% (IQ3) | 2.4% | 1.3% |
| Interquartile Range (IQR) | 1.5% | 0.76% |
| Standard Deviation (Sample) | 1.1% | 0.80% |
| Standard Deviation (Population) | 1.1% | 0.79% |
Similar Demographics by No Schooling Completed
Demographics Similar to Mongolians by No Schooling Completed
In terms of no schooling completed, the demographic groups most similar to Mongolians are Pima (2.1%, a difference of 0.070%), Black/African American (2.1%, a difference of 0.090%), French American Indian (2.1%, a difference of 0.19%), Immigrants from Taiwan (2.1%, a difference of 0.25%), and Immigrants from Bosnia and Herzegovina (2.1%, a difference of 0.30%).
| Demographics | Rating | Rank | No Schooling Completed |
| Pakistanis | 44.7 /100 | #178 | Average 2.1% |
| Immigrants | Kazakhstan | 44.3 /100 | #179 | Average 2.1% |
| Portuguese | 43.9 /100 | #180 | Average 2.1% |
| Immigrants | Taiwan | 42.6 /100 | #181 | Average 2.1% |
| French American Indians | 42.2 /100 | #182 | Average 2.1% |
| Blacks/African Americans | 41.4 /100 | #183 | Average 2.1% |
| Pima | 41.3 /100 | #184 | Average 2.1% |
| Mongolians | 40.8 /100 | #185 | Average 2.1% |
| Immigrants | Bosnia and Herzegovina | 38.6 /100 | #186 | Fair 2.1% |
| Navajo | 36.5 /100 | #187 | Fair 2.1% |
| Immigrants | Kenya | 36.2 /100 | #188 | Fair 2.1% |
| Immigrants | Egypt | 36.1 /100 | #189 | Fair 2.1% |
| Spanish Americans | 32.6 /100 | #190 | Fair 2.1% |
| Bermudans | 30.7 /100 | #191 | Fair 2.1% |
| Guamanians/Chamorros | 29.8 /100 | #192 | Fair 2.2% |
Demographics Similar to Latvians by No Schooling Completed
In terms of no schooling completed, the demographic groups most similar to Latvians are Italian (1.5%, a difference of 0.25%), Swiss (1.5%, a difference of 0.94%), Eastern European (1.6%, a difference of 0.95%), Inupiat (1.5%, a difference of 1.3%), and British (1.5%, a difference of 1.4%).
| Demographics | Rating | Rank | No Schooling Completed |
| Scandinavians | 100.0 /100 | #27 | Exceptional 1.5% |
| French Canadians | 100.0 /100 | #28 | Exceptional 1.5% |
| Lumbee | 100.0 /100 | #29 | Exceptional 1.5% |
| British | 100.0 /100 | #30 | Exceptional 1.5% |
| Inupiat | 100.0 /100 | #31 | Exceptional 1.5% |
| Swiss | 100.0 /100 | #32 | Exceptional 1.5% |
| Italians | 100.0 /100 | #33 | Exceptional 1.5% |
| Latvians | 100.0 /100 | #34 | Exceptional 1.5% |
| Eastern Europeans | 100.0 /100 | #35 | Exceptional 1.6% |
| Aleuts | 99.9 /100 | #36 | Exceptional 1.6% |
| Belgians | 99.9 /100 | #37 | Exceptional 1.6% |
| Northern Europeans | 99.9 /100 | #38 | Exceptional 1.6% |
| Native Hawaiians | 99.9 /100 | #39 | Exceptional 1.6% |
| Luxembourgers | 99.9 /100 | #40 | Exceptional 1.6% |
| Hungarians | 99.9 /100 | #41 | Exceptional 1.6% |