Immigrants from Bangladesh vs Immigrants from Sri Lanka No Schooling Completed
COMPARE
Immigrants from Bangladesh
Immigrants from Sri Lanka
No Schooling Completed
No Schooling Completed Comparison
Immigrants from Bangladesh
Immigrants from Sri Lanka
3.1%
NO SCHOOLING COMPLETED
0.0/ 100
METRIC RATING
320th/ 347
METRIC RANK
2.0%
NO SCHOOLING COMPLETED
67.0/ 100
METRIC RATING
157th/ 347
METRIC RANK
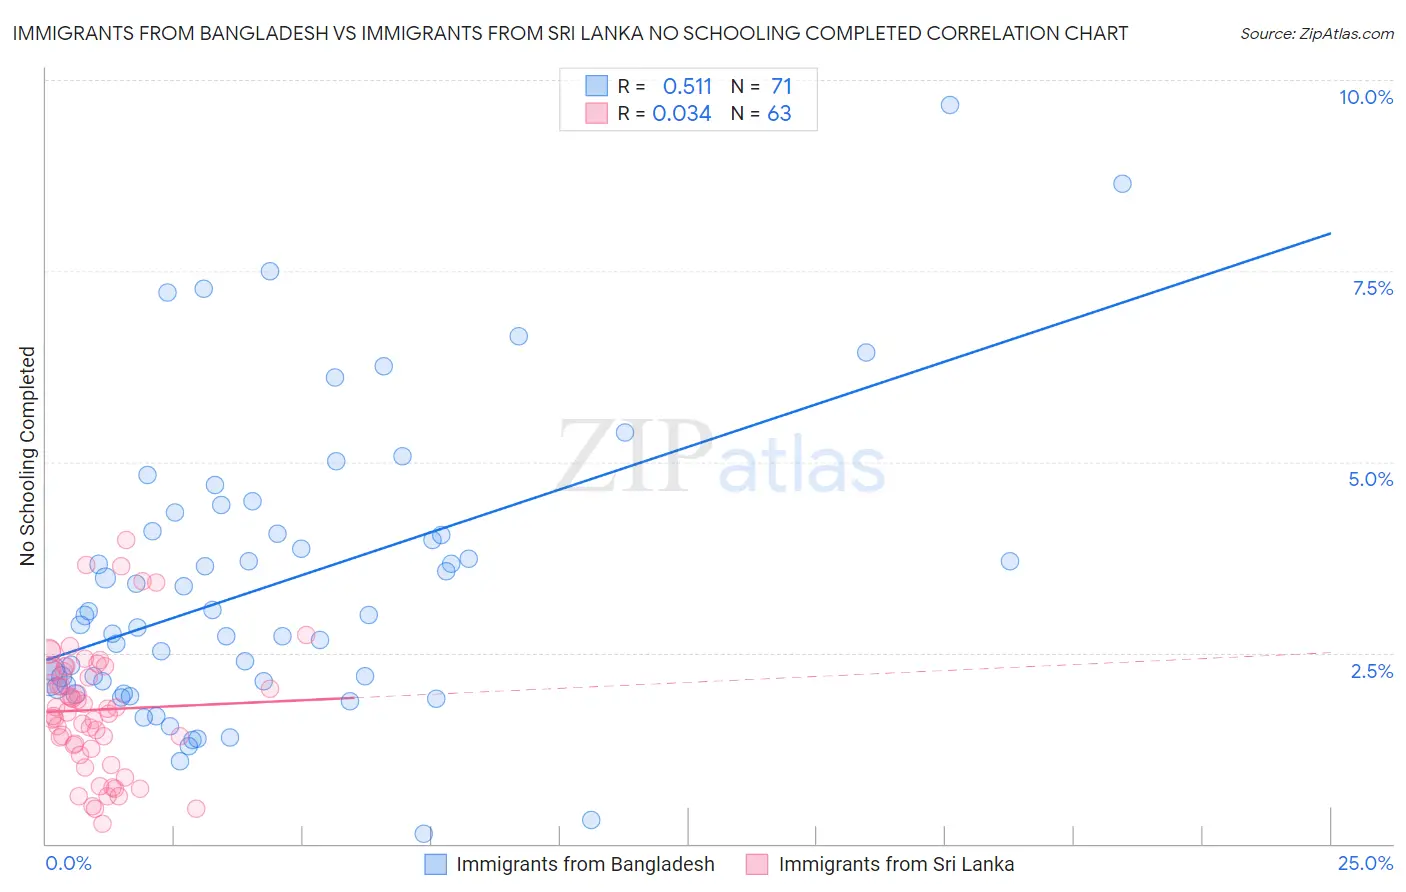
Immigrants from Bangladesh vs Immigrants from Sri Lanka No Schooling Completed Correlation Chart
The statistical analysis conducted on geographies consisting of 203,165,011 people shows a substantial positive correlation between the proportion of Immigrants from Bangladesh and percentage of population with no schooling in the United States with a correlation coefficient (R) of 0.511 and weighted average of 3.1%. Similarly, the statistical analysis conducted on geographies consisting of 149,315,237 people shows no correlation between the proportion of Immigrants from Sri Lanka and percentage of population with no schooling in the United States with a correlation coefficient (R) of 0.034 and weighted average of 2.0%, a difference of 54.1%.
No Schooling Completed Correlation Summary
| Measurement | Immigrants from Bangladesh | Immigrants from Sri Lanka |
| Minimum | 0.13% | 0.26% |
| Maximum | 9.7% | 4.0% |
| Range | 9.6% | 3.7% |
| Mean | 3.4% | 1.8% |
| Median | 3.0% | 1.7% |
| Interquartile 25% (IQ1) | 2.1% | 1.2% |
| Interquartile 75% (IQ3) | 4.1% | 2.3% |
| Interquartile Range (IQR) | 2.0% | 1.0% |
| Standard Deviation (Sample) | 1.9% | 0.83% |
| Standard Deviation (Population) | 1.9% | 0.82% |
Similar Demographics by No Schooling Completed
Demographics Similar to Immigrants from Bangladesh by No Schooling Completed
In terms of no schooling completed, the demographic groups most similar to Immigrants from Bangladesh are Immigrants from Burma/Myanmar (3.1%, a difference of 0.040%), Immigrants from Laos (3.1%, a difference of 0.11%), Immigrants from Guyana (3.1%, a difference of 0.78%), Immigrants from Honduras (3.2%, a difference of 0.79%), and Vietnamese (3.2%, a difference of 0.98%).
| Demographics | Rating | Rank | No Schooling Completed |
| Hondurans | 0.0 /100 | #313 | Tragic 3.1% |
| Immigrants | Belize | 0.0 /100 | #314 | Tragic 3.1% |
| Immigrants | Nicaragua | 0.0 /100 | #315 | Tragic 3.1% |
| Immigrants | Ecuador | 0.0 /100 | #316 | Tragic 3.1% |
| Cape Verdeans | 0.0 /100 | #317 | Tragic 3.1% |
| Immigrants | Guyana | 0.0 /100 | #318 | Tragic 3.1% |
| Immigrants | Burma/Myanmar | 0.0 /100 | #319 | Tragic 3.1% |
| Immigrants | Bangladesh | 0.0 /100 | #320 | Tragic 3.1% |
| Immigrants | Laos | 0.0 /100 | #321 | Tragic 3.1% |
| Immigrants | Honduras | 0.0 /100 | #322 | Tragic 3.2% |
| Vietnamese | 0.0 /100 | #323 | Tragic 3.2% |
| Mexican American Indians | 0.0 /100 | #324 | Tragic 3.2% |
| Dominicans | 0.0 /100 | #325 | Tragic 3.2% |
| Indonesians | 0.0 /100 | #326 | Tragic 3.2% |
| Immigrants | Latin America | 0.0 /100 | #327 | Tragic 3.3% |
Demographics Similar to Immigrants from Sri Lanka by No Schooling Completed
In terms of no schooling completed, the demographic groups most similar to Immigrants from Sri Lanka are Chilean (2.0%, a difference of 0.030%), Immigrants from Korea (2.0%, a difference of 0.040%), Immigrants from Spain (2.0%, a difference of 0.090%), Immigrants from Russia (2.0%, a difference of 0.10%), and Kenyan (2.0%, a difference of 0.20%).
| Demographics | Rating | Rank | No Schooling Completed |
| Blackfeet | 72.9 /100 | #150 | Good 2.0% |
| Immigrants | Jordan | 70.9 /100 | #151 | Good 2.0% |
| Immigrants | Eastern Europe | 70.4 /100 | #152 | Good 2.0% |
| Immigrants | Italy | 68.9 /100 | #153 | Good 2.0% |
| Immigrants | Venezuela | 68.5 /100 | #154 | Good 2.0% |
| Immigrants | Russia | 67.6 /100 | #155 | Good 2.0% |
| Chileans | 67.2 /100 | #156 | Good 2.0% |
| Immigrants | Sri Lanka | 67.0 /100 | #157 | Good 2.0% |
| Immigrants | Korea | 66.7 /100 | #158 | Good 2.0% |
| Immigrants | Spain | 66.4 /100 | #159 | Good 2.0% |
| Kenyans | 65.7 /100 | #160 | Good 2.0% |
| Ugandans | 64.6 /100 | #161 | Good 2.0% |
| Immigrants | Brazil | 63.8 /100 | #162 | Good 2.1% |
| Albanians | 62.2 /100 | #163 | Good 2.1% |
| Comanche | 60.7 /100 | #164 | Good 2.1% |