European vs Irish No Schooling Completed
COMPARE
European
Irish
No Schooling Completed
No Schooling Completed Comparison
Europeans
Irish
1.5%
NO SCHOOLING COMPLETED
100.0/ 100
METRIC RATING
23rd/ 347
METRIC RANK
1.4%
NO SCHOOLING COMPLETED
100.0/ 100
METRIC RATING
12th/ 347
METRIC RANK
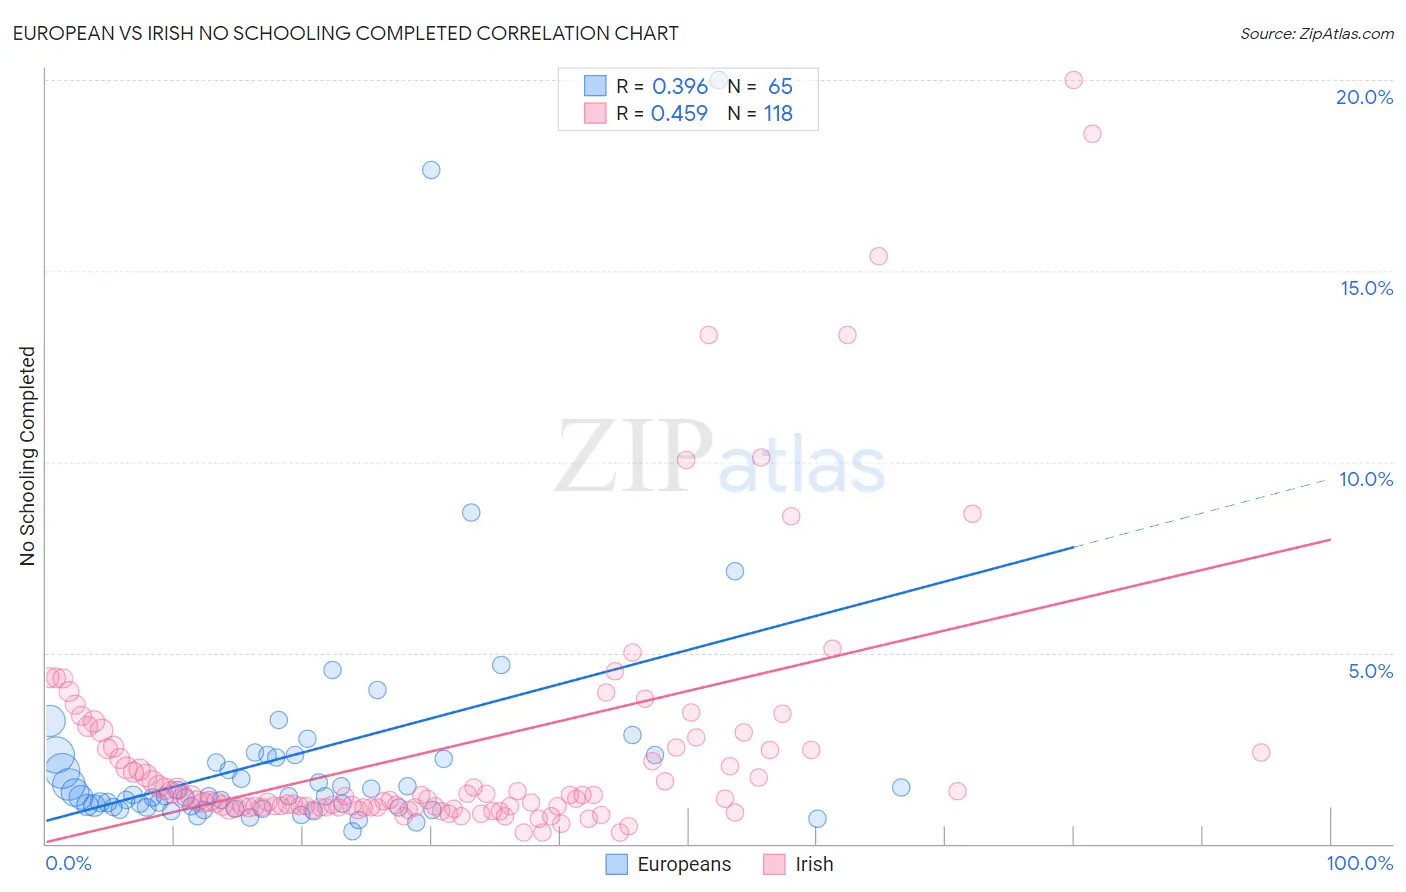
European vs Irish No Schooling Completed Correlation Chart
The statistical analysis conducted on geographies consisting of 544,915,278 people shows a mild positive correlation between the proportion of Europeans and percentage of population with no schooling in the United States with a correlation coefficient (R) of 0.396 and weighted average of 1.5%. Similarly, the statistical analysis conducted on geographies consisting of 558,904,841 people shows a moderate positive correlation between the proportion of Irish and percentage of population with no schooling in the United States with a correlation coefficient (R) of 0.459 and weighted average of 1.4%, a difference of 2.8%.
No Schooling Completed Correlation Summary
| Measurement | European | Irish |
| Minimum | 0.31% | 0.30% |
| Maximum | 20.0% | 20.0% |
| Range | 19.7% | 19.7% |
| Mean | 2.3% | 2.5% |
| Median | 1.2% | 1.2% |
| Interquartile 25% (IQ1) | 0.96% | 0.96% |
| Interquartile 75% (IQ3) | 2.3% | 2.5% |
| Interquartile Range (IQR) | 1.3% | 1.5% |
| Standard Deviation (Sample) | 3.3% | 3.4% |
| Standard Deviation (Population) | 3.3% | 3.4% |
Demographics Similar to Europeans and Irish by No Schooling Completed
In terms of no schooling completed, the demographic groups most similar to Europeans are Alaska Native (1.5%, a difference of 0.25%), Chinese (1.5%, a difference of 0.34%), Pennsylvania German (1.5%, a difference of 0.35%), French (1.5%, a difference of 0.37%), and Welsh (1.5%, a difference of 0.71%). Similarly, the demographic groups most similar to Irish are Lithuanian (1.4%, a difference of 0.030%), Polish (1.4%, a difference of 0.030%), Dutch (1.4%, a difference of 0.86%), Scotch-Irish (1.5%, a difference of 0.97%), and Tlingit-Haida (1.5%, a difference of 1.0%).
| Demographics | Rating | Rank | No Schooling Completed |
| English | 100.0 /100 | #7 | Exceptional 1.4% |
| Swedes | 100.0 /100 | #8 | Exceptional 1.4% |
| Scottish | 100.0 /100 | #9 | Exceptional 1.4% |
| Dutch | 100.0 /100 | #10 | Exceptional 1.4% |
| Lithuanians | 100.0 /100 | #11 | Exceptional 1.4% |
| Irish | 100.0 /100 | #12 | Exceptional 1.4% |
| Poles | 100.0 /100 | #13 | Exceptional 1.4% |
| Scotch-Irish | 100.0 /100 | #14 | Exceptional 1.5% |
| Tlingit-Haida | 100.0 /100 | #15 | Exceptional 1.5% |
| Finns | 100.0 /100 | #16 | Exceptional 1.5% |
| Croatians | 100.0 /100 | #17 | Exceptional 1.5% |
| Danes | 100.0 /100 | #18 | Exceptional 1.5% |
| Alaskan Athabascans | 100.0 /100 | #19 | Exceptional 1.5% |
| Welsh | 100.0 /100 | #20 | Exceptional 1.5% |
| Chinese | 100.0 /100 | #21 | Exceptional 1.5% |
| Alaska Natives | 100.0 /100 | #22 | Exceptional 1.5% |
| Europeans | 100.0 /100 | #23 | Exceptional 1.5% |
| Pennsylvania Germans | 100.0 /100 | #24 | Exceptional 1.5% |
| French | 100.0 /100 | #25 | Exceptional 1.5% |
| Czechs | 100.0 /100 | #26 | Exceptional 1.5% |
| Scandinavians | 100.0 /100 | #27 | Exceptional 1.5% |