Immigrants from Bangladesh vs Immigrants from Sri Lanka Male Unemployment
COMPARE
Immigrants from Bangladesh
Immigrants from Sri Lanka
Male Unemployment
Male Unemployment Comparison
Immigrants from Bangladesh
Immigrants from Sri Lanka
6.6%
MALE UNEMPLOYMENT
0.0/ 100
METRIC RATING
299th/ 347
METRIC RANK
5.1%
MALE UNEMPLOYMENT
94.9/ 100
METRIC RATING
88th/ 347
METRIC RANK
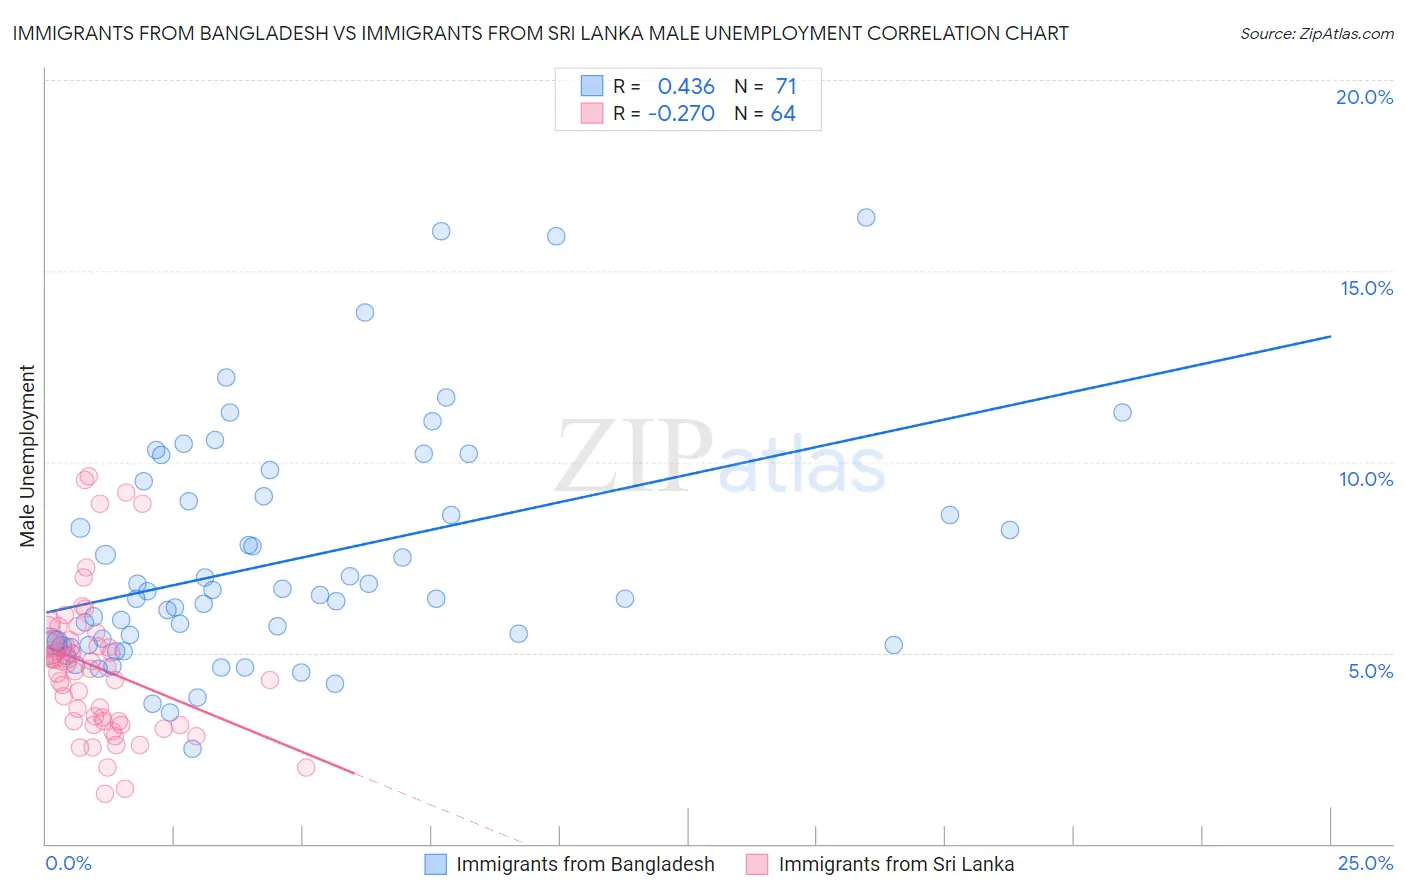
Immigrants from Bangladesh vs Immigrants from Sri Lanka Male Unemployment Correlation Chart
The statistical analysis conducted on geographies consisting of 203,494,177 people shows a moderate positive correlation between the proportion of Immigrants from Bangladesh and unemployment rate among males in the United States with a correlation coefficient (R) of 0.436 and weighted average of 6.6%. Similarly, the statistical analysis conducted on geographies consisting of 149,610,733 people shows a weak negative correlation between the proportion of Immigrants from Sri Lanka and unemployment rate among males in the United States with a correlation coefficient (R) of -0.270 and weighted average of 5.1%, a difference of 29.5%.
Male Unemployment Correlation Summary
| Measurement | Immigrants from Bangladesh | Immigrants from Sri Lanka |
| Minimum | 2.5% | 1.3% |
| Maximum | 16.4% | 9.6% |
| Range | 13.9% | 8.3% |
| Mean | 7.4% | 4.6% |
| Median | 6.4% | 4.6% |
| Interquartile 25% (IQ1) | 5.2% | 3.2% |
| Interquartile 75% (IQ3) | 9.1% | 5.3% |
| Interquartile Range (IQR) | 3.9% | 2.1% |
| Standard Deviation (Sample) | 3.0% | 1.9% |
| Standard Deviation (Population) | 3.0% | 1.8% |
Similar Demographics by Male Unemployment
Demographics Similar to Immigrants from Bangladesh by Male Unemployment
In terms of male unemployment, the demographic groups most similar to Immigrants from Bangladesh are Jamaican (6.6%, a difference of 0.13%), Chippewa (6.6%, a difference of 0.21%), Vietnamese (6.6%, a difference of 0.27%), Immigrants from Belize (6.6%, a difference of 0.38%), and Immigrants from Haiti (6.5%, a difference of 0.53%).
| Demographics | Rating | Rank | Male Unemployment |
| Nepalese | 0.0 /100 | #292 | Tragic 6.4% |
| Haitians | 0.0 /100 | #293 | Tragic 6.4% |
| Senegalese | 0.0 /100 | #294 | Tragic 6.4% |
| Belizeans | 0.0 /100 | #295 | Tragic 6.5% |
| Immigrants | Haiti | 0.0 /100 | #296 | Tragic 6.5% |
| Chippewa | 0.0 /100 | #297 | Tragic 6.6% |
| Jamaicans | 0.0 /100 | #298 | Tragic 6.6% |
| Immigrants | Bangladesh | 0.0 /100 | #299 | Tragic 6.6% |
| Vietnamese | 0.0 /100 | #300 | Tragic 6.6% |
| Immigrants | Belize | 0.0 /100 | #301 | Tragic 6.6% |
| Ute | 0.0 /100 | #302 | Tragic 6.6% |
| Immigrants | West Indies | 0.0 /100 | #303 | Tragic 6.7% |
| West Indians | 0.0 /100 | #304 | Tragic 6.7% |
| Trinidadians and Tobagonians | 0.0 /100 | #305 | Tragic 6.7% |
| Immigrants | Trinidad and Tobago | 0.0 /100 | #306 | Tragic 6.7% |
Demographics Similar to Immigrants from Sri Lanka by Male Unemployment
In terms of male unemployment, the demographic groups most similar to Immigrants from Sri Lanka are Immigrants from Australia (5.1%, a difference of 0.040%), Okinawan (5.1%, a difference of 0.040%), Immigrants from Turkey (5.1%, a difference of 0.13%), Slavic (5.1%, a difference of 0.18%), and Immigrants from Serbia (5.1%, a difference of 0.18%).
| Demographics | Rating | Rank | Male Unemployment |
| French | 96.2 /100 | #81 | Exceptional 5.0% |
| Chileans | 96.2 /100 | #82 | Exceptional 5.0% |
| Immigrants | Eritrea | 96.0 /100 | #83 | Exceptional 5.0% |
| Serbians | 95.7 /100 | #84 | Exceptional 5.1% |
| Immigrants | North Macedonia | 95.6 /100 | #85 | Exceptional 5.1% |
| Maltese | 95.5 /100 | #86 | Exceptional 5.1% |
| Immigrants | Romania | 95.4 /100 | #87 | Exceptional 5.1% |
| Immigrants | Sri Lanka | 94.9 /100 | #88 | Exceptional 5.1% |
| Immigrants | Australia | 94.7 /100 | #89 | Exceptional 5.1% |
| Okinawans | 94.7 /100 | #90 | Exceptional 5.1% |
| Immigrants | Turkey | 94.4 /100 | #91 | Exceptional 5.1% |
| Slavs | 94.2 /100 | #92 | Exceptional 5.1% |
| Immigrants | Serbia | 94.2 /100 | #93 | Exceptional 5.1% |
| Canadians | 94.1 /100 | #94 | Exceptional 5.1% |
| Italians | 93.8 /100 | #95 | Exceptional 5.1% |