South American Indian vs Immigrants from Sri Lanka No Schooling Completed
COMPARE
South American Indian
Immigrants from Sri Lanka
No Schooling Completed
No Schooling Completed Comparison
South American Indians
Immigrants from Sri Lanka
2.2%
NO SCHOOLING COMPLETED
11.0/ 100
METRIC RATING
207th/ 347
METRIC RANK
2.0%
NO SCHOOLING COMPLETED
67.0/ 100
METRIC RATING
157th/ 347
METRIC RANK
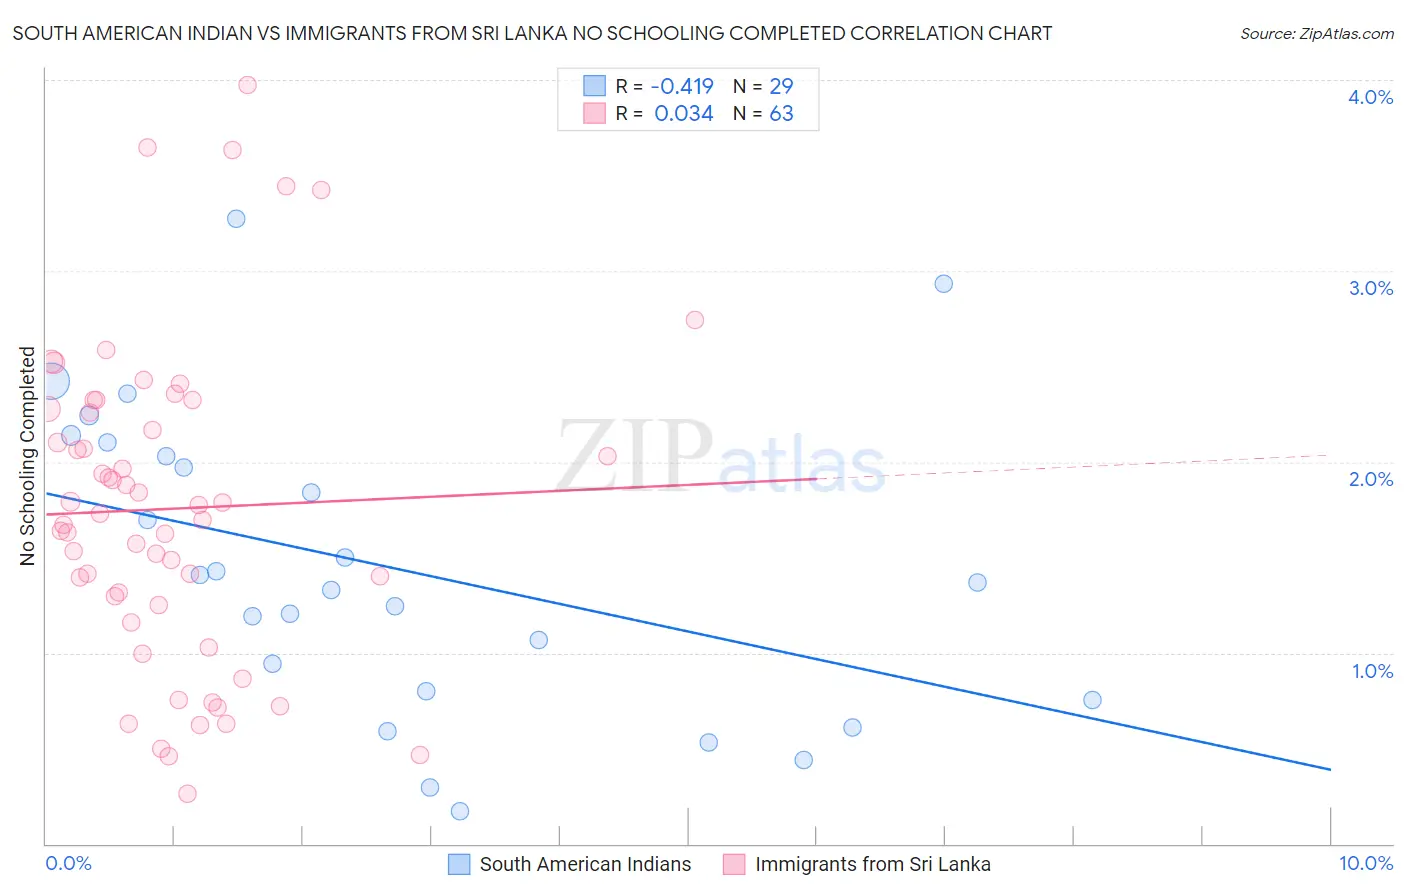
South American Indian vs Immigrants from Sri Lanka No Schooling Completed Correlation Chart
The statistical analysis conducted on geographies consisting of 164,141,114 people shows a moderate negative correlation between the proportion of South American Indians and percentage of population with no schooling in the United States with a correlation coefficient (R) of -0.419 and weighted average of 2.2%. Similarly, the statistical analysis conducted on geographies consisting of 149,315,237 people shows no correlation between the proportion of Immigrants from Sri Lanka and percentage of population with no schooling in the United States with a correlation coefficient (R) of 0.034 and weighted average of 2.0%, a difference of 9.6%.
No Schooling Completed Correlation Summary
| Measurement | South American Indian | Immigrants from Sri Lanka |
| Minimum | 0.17% | 0.26% |
| Maximum | 3.3% | 4.0% |
| Range | 3.1% | 3.7% |
| Mean | 1.4% | 1.8% |
| Median | 1.4% | 1.7% |
| Interquartile 25% (IQ1) | 0.77% | 1.2% |
| Interquartile 75% (IQ3) | 2.1% | 2.3% |
| Interquartile Range (IQR) | 1.3% | 1.0% |
| Standard Deviation (Sample) | 0.79% | 0.83% |
| Standard Deviation (Population) | 0.78% | 0.82% |
Similar Demographics by No Schooling Completed
Demographics Similar to South American Indians by No Schooling Completed
In terms of no schooling completed, the demographic groups most similar to South American Indians are Uruguayan (2.2%, a difference of 0.0%), Bahamian (2.2%, a difference of 0.18%), Immigrants from Bahamas (2.2%, a difference of 0.19%), Immigrants from Oceania (2.2%, a difference of 0.26%), and Native/Alaskan (2.2%, a difference of 0.33%).
| Demographics | Rating | Rank | No Schooling Completed |
| Immigrants | Northern Africa | 19.5 /100 | #200 | Poor 2.2% |
| Costa Ricans | 17.1 /100 | #201 | Poor 2.2% |
| Moroccans | 13.7 /100 | #202 | Poor 2.2% |
| Laotians | 13.3 /100 | #203 | Poor 2.2% |
| Hopi | 12.9 /100 | #204 | Poor 2.2% |
| Immigrants | Bahamas | 11.6 /100 | #205 | Poor 2.2% |
| Bahamians | 11.6 /100 | #206 | Poor 2.2% |
| South American Indians | 11.0 /100 | #207 | Poor 2.2% |
| Uruguayans | 11.0 /100 | #208 | Poor 2.2% |
| Immigrants | Oceania | 10.2 /100 | #209 | Poor 2.2% |
| Natives/Alaskans | 10.0 /100 | #210 | Tragic 2.2% |
| Immigrants | Panama | 8.8 /100 | #211 | Tragic 2.3% |
| Immigrants | Morocco | 8.7 /100 | #212 | Tragic 2.3% |
| Ute | 8.2 /100 | #213 | Tragic 2.3% |
| Samoans | 8.2 /100 | #214 | Tragic 2.3% |
Demographics Similar to Immigrants from Sri Lanka by No Schooling Completed
In terms of no schooling completed, the demographic groups most similar to Immigrants from Sri Lanka are Chilean (2.0%, a difference of 0.030%), Immigrants from Korea (2.0%, a difference of 0.040%), Immigrants from Spain (2.0%, a difference of 0.090%), Immigrants from Russia (2.0%, a difference of 0.10%), and Kenyan (2.0%, a difference of 0.20%).
| Demographics | Rating | Rank | No Schooling Completed |
| Blackfeet | 72.9 /100 | #150 | Good 2.0% |
| Immigrants | Jordan | 70.9 /100 | #151 | Good 2.0% |
| Immigrants | Eastern Europe | 70.4 /100 | #152 | Good 2.0% |
| Immigrants | Italy | 68.9 /100 | #153 | Good 2.0% |
| Immigrants | Venezuela | 68.5 /100 | #154 | Good 2.0% |
| Immigrants | Russia | 67.6 /100 | #155 | Good 2.0% |
| Chileans | 67.2 /100 | #156 | Good 2.0% |
| Immigrants | Sri Lanka | 67.0 /100 | #157 | Good 2.0% |
| Immigrants | Korea | 66.7 /100 | #158 | Good 2.0% |
| Immigrants | Spain | 66.4 /100 | #159 | Good 2.0% |
| Kenyans | 65.7 /100 | #160 | Good 2.0% |
| Ugandans | 64.6 /100 | #161 | Good 2.0% |
| Immigrants | Brazil | 63.8 /100 | #162 | Good 2.1% |
| Albanians | 62.2 /100 | #163 | Good 2.1% |
| Comanche | 60.7 /100 | #164 | Good 2.1% |