Immigrants from Indonesia vs Immigrants from Grenada 4th Grade
COMPARE
Immigrants from Indonesia
Immigrants from Grenada
4th Grade
4th Grade Comparison
Immigrants from Indonesia
Immigrants from Grenada
97.1%
4TH GRADE
1.5/ 100
METRIC RATING
241st/ 347
METRIC RANK
96.7%
4TH GRADE
0.0/ 100
METRIC RATING
291st/ 347
METRIC RANK
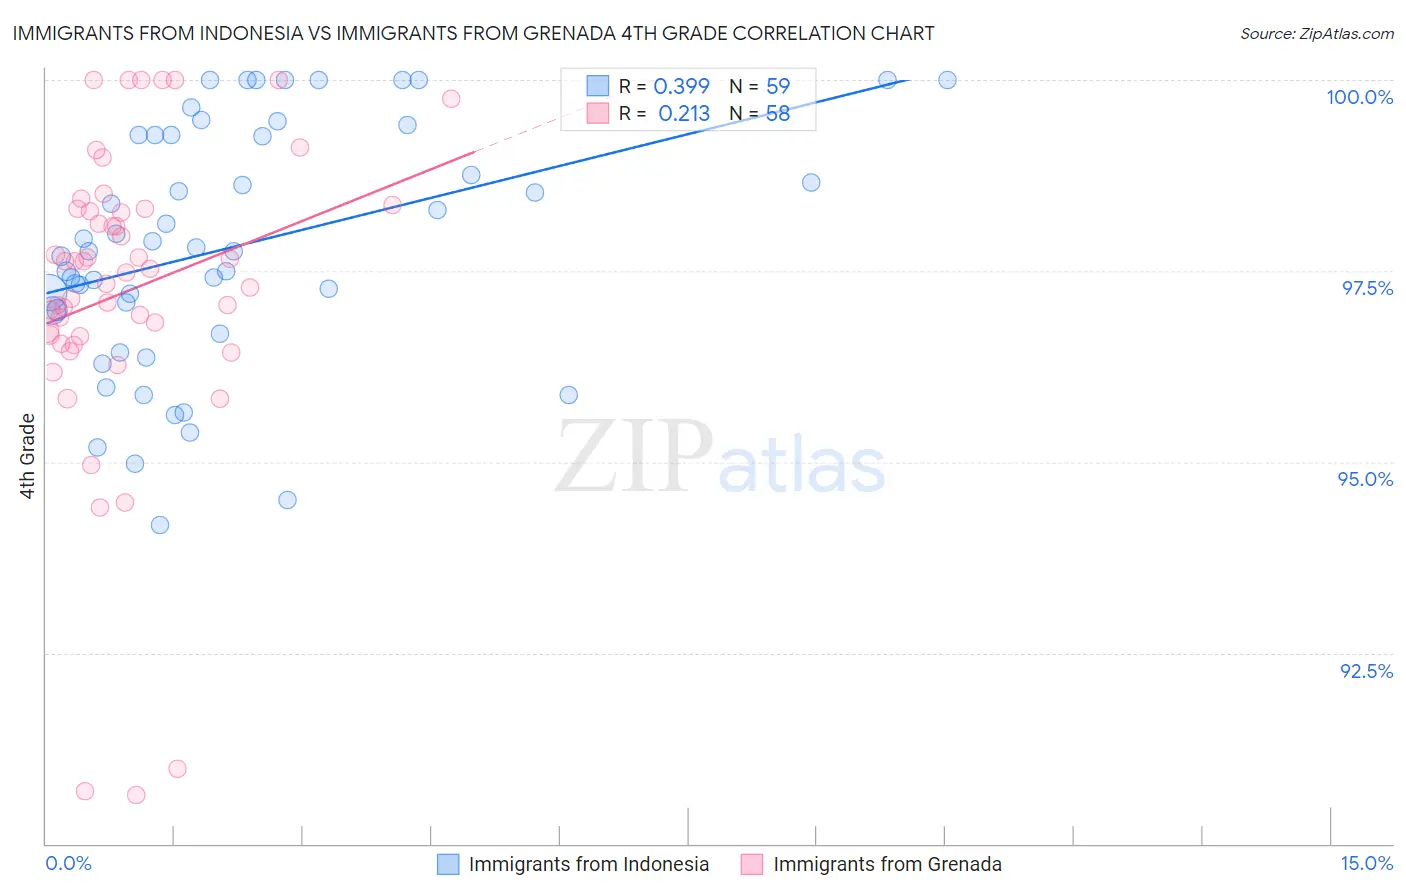
Immigrants from Indonesia vs Immigrants from Grenada 4th Grade Correlation Chart
The statistical analysis conducted on geographies consisting of 215,782,971 people shows a mild positive correlation between the proportion of Immigrants from Indonesia and percentage of population with at least 4th grade education in the United States with a correlation coefficient (R) of 0.399 and weighted average of 97.1%. Similarly, the statistical analysis conducted on geographies consisting of 67,199,790 people shows a weak positive correlation between the proportion of Immigrants from Grenada and percentage of population with at least 4th grade education in the United States with a correlation coefficient (R) of 0.213 and weighted average of 96.7%, a difference of 0.44%.
4th Grade Correlation Summary
| Measurement | Immigrants from Indonesia | Immigrants from Grenada |
| Minimum | 94.2% | 90.6% |
| Maximum | 100.0% | 100.0% |
| Range | 5.8% | 9.4% |
| Mean | 97.8% | 97.2% |
| Median | 97.8% | 97.5% |
| Interquartile 25% (IQ1) | 97.0% | 96.6% |
| Interquartile 75% (IQ3) | 99.3% | 98.3% |
| Interquartile Range (IQR) | 2.3% | 1.7% |
| Standard Deviation (Sample) | 1.6% | 2.0% |
| Standard Deviation (Population) | 1.6% | 2.0% |
Similar Demographics by 4th Grade
Demographics Similar to Immigrants from Indonesia by 4th Grade
In terms of 4th grade, the demographic groups most similar to Immigrants from Indonesia are Colombian (97.1%, a difference of 0.0%), Nigerian (97.1%, a difference of 0.010%), Asian (97.1%, a difference of 0.010%), U.S. Virgin Islander (97.1%, a difference of 0.010%), and Indian (Asian) (97.2%, a difference of 0.020%).
| Demographics | Rating | Rank | 4th Grade |
| Assyrians/Chaldeans/Syriacs | 3.0 /100 | #234 | Tragic 97.2% |
| Yuman | 2.9 /100 | #235 | Tragic 97.2% |
| Immigrants | Eastern Asia | 2.7 /100 | #236 | Tragic 97.2% |
| Immigrants | Costa Rica | 2.0 /100 | #237 | Tragic 97.2% |
| Indians (Asian) | 1.9 /100 | #238 | Tragic 97.2% |
| Nigerians | 1.8 /100 | #239 | Tragic 97.1% |
| Colombians | 1.6 /100 | #240 | Tragic 97.1% |
| Immigrants | Indonesia | 1.5 /100 | #241 | Tragic 97.1% |
| Asians | 1.4 /100 | #242 | Tragic 97.1% |
| U.S. Virgin Islanders | 1.4 /100 | #243 | Tragic 97.1% |
| Koreans | 1.3 /100 | #244 | Tragic 97.1% |
| Immigrants | Eastern Africa | 1.2 /100 | #245 | Tragic 97.1% |
| Immigrants | Uruguay | 1.2 /100 | #246 | Tragic 97.1% |
| Ethiopians | 1.2 /100 | #247 | Tragic 97.1% |
| Immigrants | Asia | 1.2 /100 | #248 | Tragic 97.1% |
Demographics Similar to Immigrants from Grenada by 4th Grade
In terms of 4th grade, the demographic groups most similar to Immigrants from Grenada are Malaysian (96.7%, a difference of 0.010%), British West Indian (96.7%, a difference of 0.030%), Puerto Rican (96.7%, a difference of 0.030%), Immigrants from West Indies (96.7%, a difference of 0.040%), and Immigrants from Eritrea (96.7%, a difference of 0.050%).
| Demographics | Rating | Rank | 4th Grade |
| Immigrants | St. Vincent and the Grenadines | 0.1 /100 | #284 | Tragic 96.8% |
| Immigrants | Barbados | 0.0 /100 | #285 | Tragic 96.8% |
| Immigrants | Thailand | 0.0 /100 | #286 | Tragic 96.8% |
| Houma | 0.0 /100 | #287 | Tragic 96.8% |
| Immigrants | Afghanistan | 0.0 /100 | #288 | Tragic 96.8% |
| Immigrants | West Indies | 0.0 /100 | #289 | Tragic 96.7% |
| British West Indians | 0.0 /100 | #290 | Tragic 96.7% |
| Immigrants | Grenada | 0.0 /100 | #291 | Tragic 96.7% |
| Malaysians | 0.0 /100 | #292 | Tragic 96.7% |
| Puerto Ricans | 0.0 /100 | #293 | Tragic 96.7% |
| Immigrants | Eritrea | 0.0 /100 | #294 | Tragic 96.7% |
| Immigrants | Portugal | 0.0 /100 | #295 | Tragic 96.6% |
| Somalis | 0.0 /100 | #296 | Tragic 96.6% |
| Immigrants | Somalia | 0.0 /100 | #297 | Tragic 96.5% |
| Haitians | 0.0 /100 | #298 | Tragic 96.5% |