Blackfeet vs Immigrants from Eritrea 12th Grade, No Diploma
COMPARE
Blackfeet
Immigrants from Eritrea
12th Grade, No Diploma
12th Grade, No Diploma Comparison
Blackfeet
Immigrants from Eritrea
90.1%
12TH GRADE, NO DIPLOMA
2.4/ 100
METRIC RATING
232nd/ 347
METRIC RANK
89.9%
12TH GRADE, NO DIPLOMA
1.0/ 100
METRIC RATING
250th/ 347
METRIC RANK
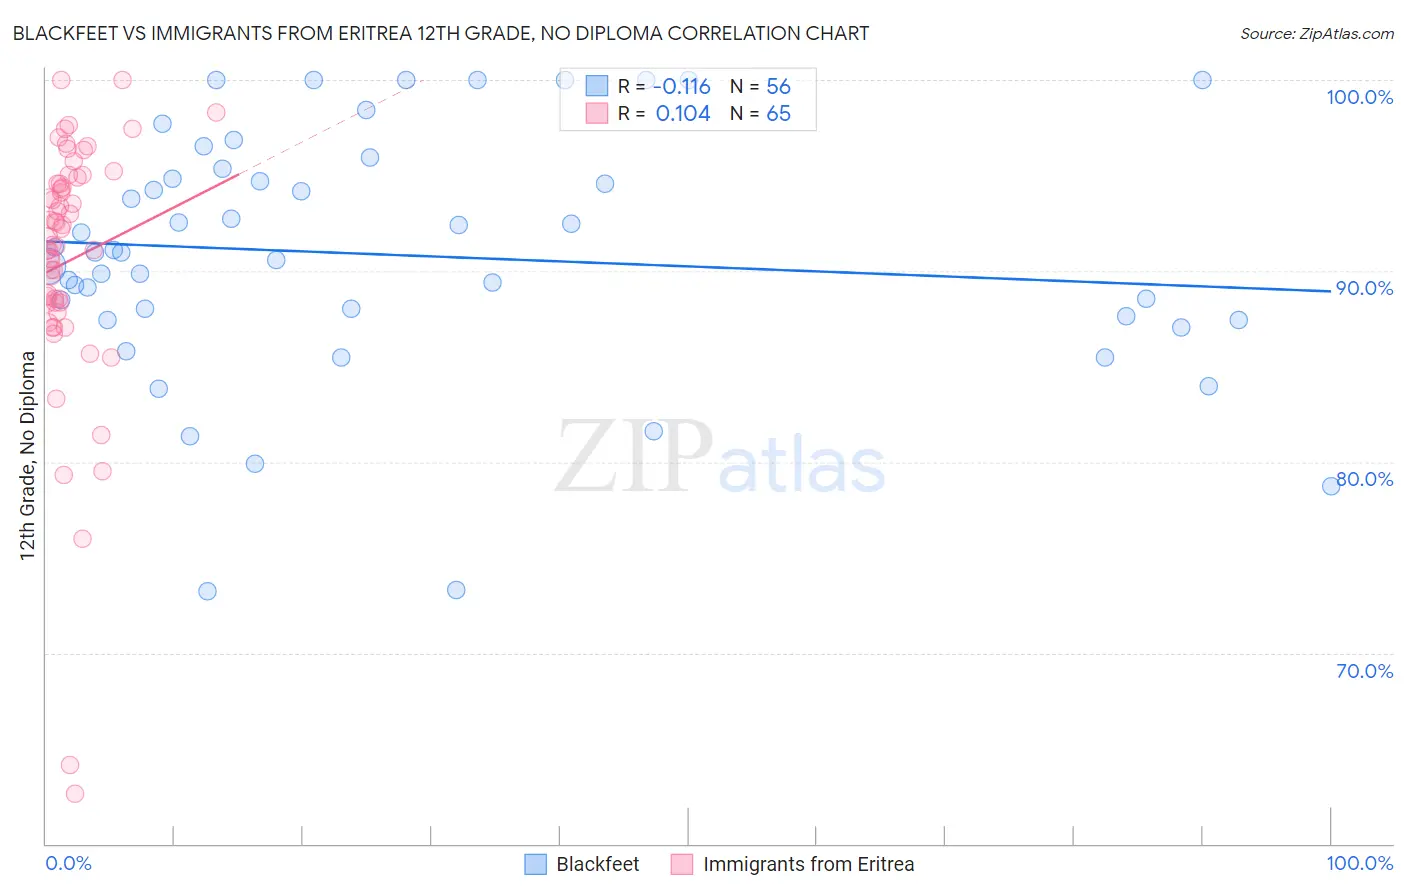
Blackfeet vs Immigrants from Eritrea 12th Grade, No Diploma Correlation Chart
The statistical analysis conducted on geographies consisting of 309,582,133 people shows a poor negative correlation between the proportion of Blackfeet and percentage of population with at least 12th grade (no diploma) education in the United States with a correlation coefficient (R) of -0.116 and weighted average of 90.1%. Similarly, the statistical analysis conducted on geographies consisting of 104,792,854 people shows a poor positive correlation between the proportion of Immigrants from Eritrea and percentage of population with at least 12th grade (no diploma) education in the United States with a correlation coefficient (R) of 0.104 and weighted average of 89.9%, a difference of 0.29%.
12th Grade, No Diploma Correlation Summary
| Measurement | Blackfeet | Immigrants from Eritrea |
| Minimum | 73.2% | 62.6% |
| Maximum | 100.0% | 100.0% |
| Range | 26.8% | 37.4% |
| Mean | 90.8% | 90.5% |
| Median | 91.0% | 91.8% |
| Interquartile 25% (IQ1) | 87.6% | 88.3% |
| Interquartile 75% (IQ3) | 95.1% | 94.7% |
| Interquartile Range (IQR) | 7.5% | 6.4% |
| Standard Deviation (Sample) | 6.5% | 6.9% |
| Standard Deviation (Population) | 6.4% | 6.8% |
Demographics Similar to Blackfeet and Immigrants from Eritrea by 12th Grade, No Diploma
In terms of 12th grade, no diploma, the demographic groups most similar to Blackfeet are Immigrants from Thailand (90.1%, a difference of 0.020%), Immigrants from South America (90.1%, a difference of 0.020%), Colville (90.1%, a difference of 0.020%), Immigrants from Uzbekistan (90.1%, a difference of 0.020%), and Peruvian (90.2%, a difference of 0.030%). Similarly, the demographic groups most similar to Immigrants from Eritrea are Spanish American (89.9%, a difference of 0.010%), Comanche (89.9%, a difference of 0.030%), Senegalese (89.9%, a difference of 0.030%), Immigrants from Nigeria (89.9%, a difference of 0.090%), and Ghanaian (90.0%, a difference of 0.10%).
| Demographics | Rating | Rank | 12th Grade, No Diploma |
| Peruvians | 2.7 /100 | #231 | Tragic 90.2% |
| Blackfeet | 2.4 /100 | #232 | Tragic 90.1% |
| Immigrants | Thailand | 2.3 /100 | #233 | Tragic 90.1% |
| Immigrants | South America | 2.3 /100 | #234 | Tragic 90.1% |
| Colville | 2.3 /100 | #235 | Tragic 90.1% |
| Immigrants | Uzbekistan | 2.2 /100 | #236 | Tragic 90.1% |
| Immigrants | Colombia | 2.1 /100 | #237 | Tragic 90.1% |
| Inupiat | 2.0 /100 | #238 | Tragic 90.1% |
| Sub-Saharan Africans | 1.9 /100 | #239 | Tragic 90.1% |
| Kiowa | 1.7 /100 | #240 | Tragic 90.0% |
| Immigrants | Middle Africa | 1.7 /100 | #241 | Tragic 90.0% |
| Immigrants | Costa Rica | 1.6 /100 | #242 | Tragic 90.0% |
| Crow | 1.5 /100 | #243 | Tragic 90.0% |
| Taiwanese | 1.5 /100 | #244 | Tragic 90.0% |
| Immigrants | Uruguay | 1.4 /100 | #245 | Tragic 90.0% |
| Ghanaians | 1.3 /100 | #246 | Tragic 90.0% |
| Immigrants | Nigeria | 1.3 /100 | #247 | Tragic 89.9% |
| Comanche | 1.1 /100 | #248 | Tragic 89.9% |
| Senegalese | 1.1 /100 | #249 | Tragic 89.9% |
| Immigrants | Eritrea | 1.0 /100 | #250 | Tragic 89.9% |
| Spanish Americans | 0.9 /100 | #251 | Tragic 89.9% |