Immigrants from Bangladesh vs Immigrants from Dominican Republic Unemployment Among Ages 20 to 24 years
COMPARE
Immigrants from Bangladesh
Immigrants from Dominican Republic
Unemployment Among Ages 20 to 24 years
Unemployment Among Ages 20 to 24 years Comparison
Immigrants from Bangladesh
Immigrants from Dominican Republic
12.6%
UNEMPLOYMENT AMONG AGES 20 TO 24 YEARS
0.0/ 100
METRIC RATING
309th/ 347
METRIC RANK
13.6%
UNEMPLOYMENT AMONG AGES 20 TO 24 YEARS
0.0/ 100
METRIC RATING
327th/ 347
METRIC RANK
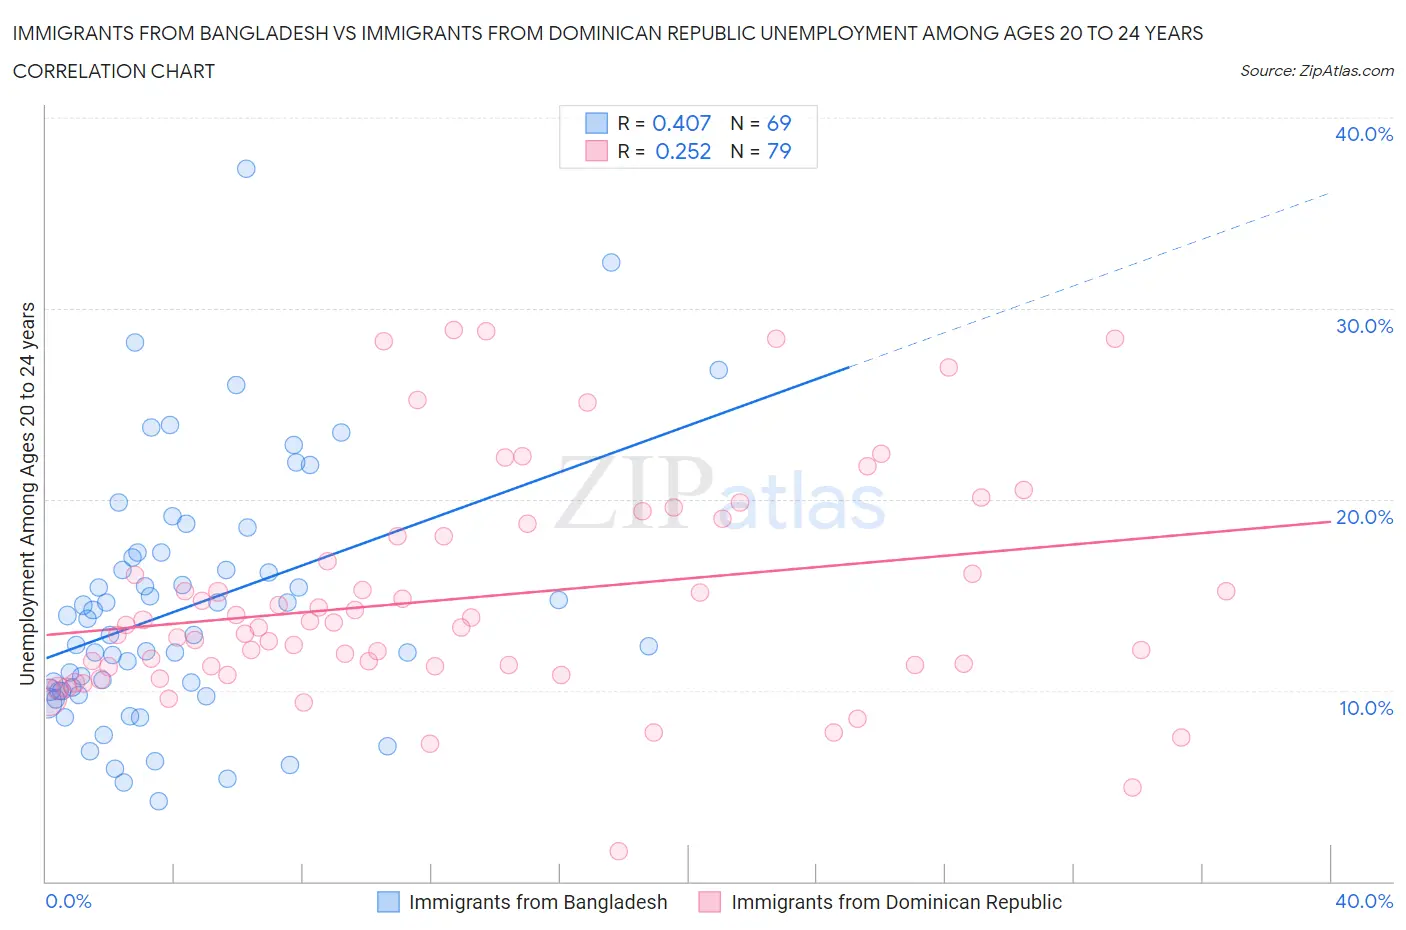
Immigrants from Bangladesh vs Immigrants from Dominican Republic Unemployment Among Ages 20 to 24 years Correlation Chart
The statistical analysis conducted on geographies consisting of 201,651,258 people shows a moderate positive correlation between the proportion of Immigrants from Bangladesh and unemployment rate among population between the ages 20 and 24 in the United States with a correlation coefficient (R) of 0.407 and weighted average of 12.6%. Similarly, the statistical analysis conducted on geographies consisting of 268,842,062 people shows a weak positive correlation between the proportion of Immigrants from Dominican Republic and unemployment rate among population between the ages 20 and 24 in the United States with a correlation coefficient (R) of 0.252 and weighted average of 13.6%, a difference of 8.7%.
Unemployment Among Ages 20 to 24 years Correlation Summary
| Measurement | Immigrants from Bangladesh | Immigrants from Dominican Republic |
| Minimum | 4.2% | 1.6% |
| Maximum | 37.3% | 28.9% |
| Range | 33.1% | 27.3% |
| Mean | 14.3% | 14.8% |
| Median | 12.9% | 13.4% |
| Interquartile 25% (IQ1) | 10.0% | 11.2% |
| Interquartile 75% (IQ3) | 17.1% | 18.1% |
| Interquartile Range (IQR) | 7.1% | 6.8% |
| Standard Deviation (Sample) | 6.6% | 5.8% |
| Standard Deviation (Population) | 6.5% | 5.8% |
Demographics Similar to Immigrants from Bangladesh and Immigrants from Dominican Republic by Unemployment Among Ages 20 to 24 years
In terms of unemployment among ages 20 to 24 years, the demographic groups most similar to Immigrants from Bangladesh are Tohono O'odham (12.5%, a difference of 0.080%), Jamaican (12.6%, a difference of 0.12%), Vietnamese (12.6%, a difference of 0.57%), Houma (12.6%, a difference of 0.72%), and Shoshone (12.7%, a difference of 1.3%). Similarly, the demographic groups most similar to Immigrants from Dominican Republic are British West Indian (13.7%, a difference of 0.56%), Immigrants from Barbados (13.5%, a difference of 1.3%), Pueblo (13.2%, a difference of 3.0%), Alaska Native (13.2%, a difference of 3.3%), and Yakama (13.1%, a difference of 4.3%).
| Demographics | Rating | Rank | Unemployment Among Ages 20 to 24 years |
| Tohono O'odham | 0.0 /100 | #308 | Tragic 12.5% |
| Immigrants | Bangladesh | 0.0 /100 | #309 | Tragic 12.6% |
| Jamaicans | 0.0 /100 | #310 | Tragic 12.6% |
| Vietnamese | 0.0 /100 | #311 | Tragic 12.6% |
| Houma | 0.0 /100 | #312 | Tragic 12.6% |
| Shoshone | 0.0 /100 | #313 | Tragic 12.7% |
| Blacks/African Americans | 0.0 /100 | #314 | Tragic 12.7% |
| West Indians | 0.0 /100 | #315 | Tragic 12.8% |
| Immigrants | Dominica | 0.0 /100 | #316 | Tragic 12.8% |
| Immigrants | Trinidad and Tobago | 0.0 /100 | #317 | Tragic 12.8% |
| Barbadians | 0.0 /100 | #318 | Tragic 12.9% |
| Trinidadians and Tobagonians | 0.0 /100 | #319 | Tragic 12.9% |
| Cheyenne | 0.0 /100 | #320 | Tragic 13.0% |
| Immigrants | Jamaica | 0.0 /100 | #321 | Tragic 13.0% |
| Natives/Alaskans | 0.0 /100 | #322 | Tragic 13.0% |
| Yakama | 0.0 /100 | #323 | Tragic 13.1% |
| Alaska Natives | 0.0 /100 | #324 | Tragic 13.2% |
| Pueblo | 0.0 /100 | #325 | Tragic 13.2% |
| Immigrants | Barbados | 0.0 /100 | #326 | Tragic 13.5% |
| Immigrants | Dominican Republic | 0.0 /100 | #327 | Tragic 13.6% |
| British West Indians | 0.0 /100 | #328 | Tragic 13.7% |