Immigrants from Bahamas vs Chinese 5th Grade
COMPARE
Immigrants from Bahamas
Chinese
5th Grade
5th Grade Comparison
Immigrants from Bahamas
Chinese
97.2%
5TH GRADE
14.9/ 100
METRIC RATING
203rd/ 347
METRIC RANK
98.1%
5TH GRADE
100.0/ 100
METRIC RATING
34th/ 347
METRIC RANK
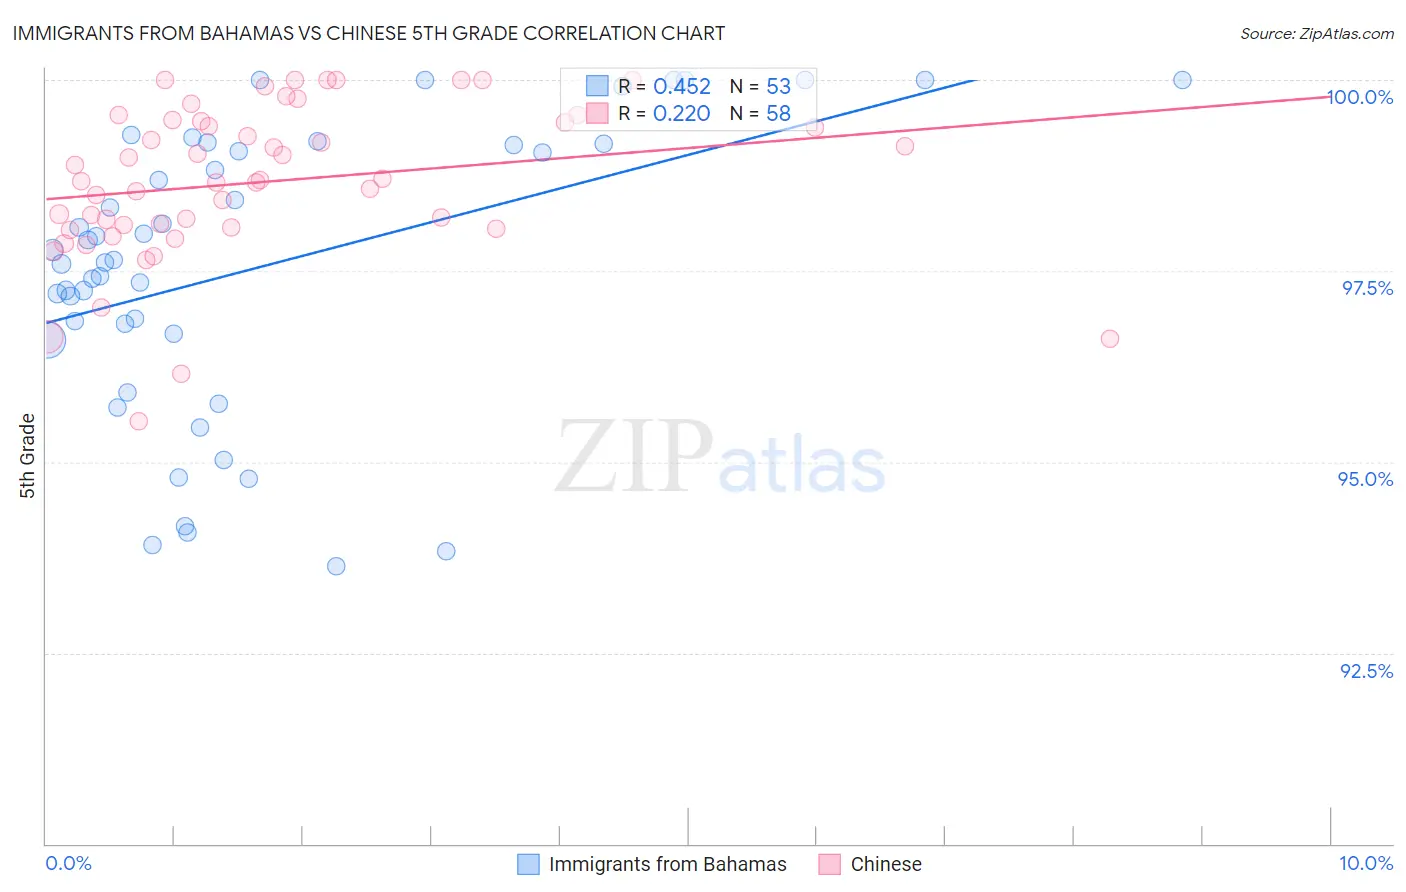
Immigrants from Bahamas vs Chinese 5th Grade Correlation Chart
The statistical analysis conducted on geographies consisting of 104,665,087 people shows a moderate positive correlation between the proportion of Immigrants from Bahamas and percentage of population with at least 5th grade education in the United States with a correlation coefficient (R) of 0.452 and weighted average of 97.2%. Similarly, the statistical analysis conducted on geographies consisting of 64,808,307 people shows a weak positive correlation between the proportion of Chinese and percentage of population with at least 5th grade education in the United States with a correlation coefficient (R) of 0.220 and weighted average of 98.1%, a difference of 1.0%.
5th Grade Correlation Summary
| Measurement | Immigrants from Bahamas | Chinese |
| Minimum | 93.6% | 95.5% |
| Maximum | 100.0% | 100.0% |
| Range | 6.4% | 4.5% |
| Mean | 97.5% | 98.7% |
| Median | 97.7% | 98.7% |
| Interquartile 25% (IQ1) | 96.6% | 98.1% |
| Interquartile 75% (IQ3) | 99.2% | 99.5% |
| Interquartile Range (IQR) | 2.5% | 1.4% |
| Standard Deviation (Sample) | 1.9% | 1.0% |
| Standard Deviation (Population) | 1.8% | 1.0% |
Similar Demographics by 5th Grade
Demographics Similar to Immigrants from Bahamas by 5th Grade
In terms of 5th grade, the demographic groups most similar to Immigrants from Bahamas are African (97.2%, a difference of 0.0%), Immigrants from Northern Africa (97.2%, a difference of 0.010%), Immigrants from Chile (97.2%, a difference of 0.010%), Immigrants from Zaire (97.1%, a difference of 0.010%), and Native/Alaskan (97.2%, a difference of 0.020%).
| Demographics | Rating | Rank | 5th Grade |
| Hawaiians | 25.6 /100 | #196 | Fair 97.2% |
| Brazilians | 25.4 /100 | #197 | Fair 97.2% |
| Immigrants | Uganda | 21.1 /100 | #198 | Fair 97.2% |
| Natives/Alaskans | 18.0 /100 | #199 | Poor 97.2% |
| Immigrants | Northern Africa | 16.8 /100 | #200 | Poor 97.2% |
| Immigrants | Chile | 16.6 /100 | #201 | Poor 97.2% |
| Africans | 15.3 /100 | #202 | Poor 97.2% |
| Immigrants | Bahamas | 14.9 /100 | #203 | Poor 97.2% |
| Immigrants | Zaire | 13.7 /100 | #204 | Poor 97.1% |
| Moroccans | 12.0 /100 | #205 | Poor 97.1% |
| Paiute | 11.6 /100 | #206 | Poor 97.1% |
| Iraqis | 10.9 /100 | #207 | Poor 97.1% |
| Laotians | 10.8 /100 | #208 | Poor 97.1% |
| Immigrants | Nepal | 10.3 /100 | #209 | Poor 97.1% |
| Immigrants | Oceania | 10.0 /100 | #210 | Poor 97.1% |
Demographics Similar to Chinese by 5th Grade
In terms of 5th grade, the demographic groups most similar to Chinese are Swiss (98.1%, a difference of 0.0%), Chippewa (98.1%, a difference of 0.010%), Italian (98.1%, a difference of 0.010%), British (98.1%, a difference of 0.020%), and Latvian (98.1%, a difference of 0.040%).
| Demographics | Rating | Rank | 5th Grade |
| French | 100.0 /100 | #27 | Exceptional 98.2% |
| Czechs | 100.0 /100 | #28 | Exceptional 98.2% |
| Scandinavians | 100.0 /100 | #29 | Exceptional 98.2% |
| French Canadians | 100.0 /100 | #30 | Exceptional 98.2% |
| Europeans | 100.0 /100 | #31 | Exceptional 98.2% |
| Chippewa | 100.0 /100 | #32 | Exceptional 98.1% |
| Swiss | 100.0 /100 | #33 | Exceptional 98.1% |
| Chinese | 100.0 /100 | #34 | Exceptional 98.1% |
| Italians | 100.0 /100 | #35 | Exceptional 98.1% |
| British | 100.0 /100 | #36 | Exceptional 98.1% |
| Latvians | 99.9 /100 | #37 | Exceptional 98.1% |
| Belgians | 99.9 /100 | #38 | Exceptional 98.1% |
| Luxembourgers | 99.9 /100 | #39 | Exceptional 98.1% |
| Eastern Europeans | 99.9 /100 | #40 | Exceptional 98.1% |
| Hungarians | 99.9 /100 | #41 | Exceptional 98.0% |