Immigrants from Bahamas vs French American Indian Master's Degree

COMPARE

Immigrants from Bahamas
Race
Ancestry
AfghanAfricanAlaska NativeAlaskan AthabascanAlbanianAleutAlsatianAmericanApacheArabArapahoArgentineanArmenianAssyrian/Chaldean/SyriacAustralianAustrianBahamianBangladeshiBarbadianBasqueBelgianBelizeanBermudanBhutaneseBlackfeetBolivianBrazilianBritishBritish West IndianBulgarianBurmeseCajunCambodianCanadianCape VerdeanCarpatho RusynCelticCentral AmericanCentral American IndianCherokeeCheyenneChickasawChileanChineseChippewaChoctawColombianColvilleComancheCosta RicanCreeCreekCroatianCrowCubanCypriotCzechCzechoslovakianDanishDelawareDominicanDutchDutch West IndianEastern EuropeanEcuadorianEgyptianEnglishEstonianEthiopianEuropeanFijianFilipinoFinnishFrenchFrench CanadianGermanGerman RussianGhanaianGreekGuamanian/ChamorroGuatemalanGuyaneseHaitianHmongHonduranHopiHoumaHungarianIcelanderIndian (Asian)IndonesianInupiatIranianIraqiIrishIroquoisIsraeliItalianJamaicanJapaneseJordanianKenyanKiowaKoreanLaotianLatvianLebaneseLiberianLithuanianLumbeeLuxembourgerMacedonianMalaysianMalteseMarshalleseMenomineeMexicanMexican American IndianMongolianMoroccanNative HawaiianNavajoNepaleseNew ZealanderNicaraguanNigerianNorthern EuropeanNorwegianOkinawanOsageOttawaPaiutePakistaniPalestinianPanamanianParaguayanPennsylvania GermanPeruvianPimaPolishPortuguesePotawatomiPuebloPuerto RicanPuget Sound SalishRomanianRussianSalvadoranSamoanScandinavianScotch-IrishScottishSeminoleSenegaleseSerbianShoshoneSierra LeoneanSiouxSlavicSlovakSloveneSomaliSouth AfricanSouth AmericanSouth American IndianSoviet UnionSpaniardSpanishSpanish AmericanSpanish American IndianSri LankanSubsaharan AfricanSudaneseSwedishSwissSyrianTaiwaneseThaiTlingit-HaidaTohono O'OdhamTonganTrinidadian and TobagonianTsimshianTurkishU.S. Virgin IslanderUgandanUkrainianUruguayanUteVenezuelanVietnameseWelshWest IndianYakamaYaquiYugoslavianYumanYup'ikZimbabwean
Immigration
NonimmigrantsImmigrantsAfghanistanAfricaAlbaniaArgentinaArmeniaAsiaAustraliaAustriaBahamasBangladeshBarbadosBelarusBelgiumBelizeBoliviaBosnia and HerzegovinaBrazilBulgariaBurma/MyanmarCabo VerdeCambodiaCameroonCanadaCaribbeanCentral AmericaChileChinaColombiaCongoCosta RicaCroatiaCubaCzechoslovakiaDenmarkDominicaDominican RepublicEastern AfricaEastern AsiaEastern EuropeEcuadorEgyptEl SalvadorEnglandEritreaEthiopiaEuropeFijiFranceGermanyGhanaGreeceGrenadaGuatemalaGuyanaHaitiHondurasHong KongHungaryIndiaIndonesiaIranIraqIrelandIsraelItalyJamaicaJapanJordanKazakhstanKenyaKoreaKuwaitLaosLatin AmericaLatviaLebanonLiberiaLithuaniaMalaysiaMexicoMicronesiaMiddle AfricaMoldovaMoroccoNepalNetherlandsNicaraguaNigeriaNorth AmericaNorth MacedoniaNorthern AfricaNorthern EuropeNorwayOceaniaPakistanPanamaPeruPhilippinesPolandPortugalRomaniaRussiaSaudi ArabiaScotlandSenegalSerbiaSierra LeoneSingaporeSomaliaSouth AfricaSouth AmericaSouth Central AsiaSouth Eastern AsiaSouthern EuropeSpainSri LankaSt. Vincent and the GrenadinesSudanSwedenSwitzerlandSyriaTaiwanThailandTrinidad and TobagoTurkeyUgandaUkraineUruguayUzbekistanVenezuelaVietnamWest IndiesWestern AfricaWestern AsiaWestern EuropeYemenZaireZimbabweAzores
French American Indian
Race
Ancestry
AfghanAfricanAlaska NativeAlaskan AthabascanAlbanianAleutAlsatianAmericanApacheArabArapahoArgentineanArmenianAssyrian/Chaldean/SyriacAustralianAustrianBahamianBangladeshiBarbadianBasqueBelgianBelizeanBermudanBhutaneseBlackfeetBolivianBrazilianBritishBritish West IndianBulgarianBurmeseCajunCambodianCanadianCape VerdeanCarpatho RusynCelticCentral AmericanCentral American IndianCherokeeCheyenneChickasawChileanChineseChippewaChoctawColombianColvilleComancheCosta RicanCreeCreekCroatianCrowCubanCypriotCzechCzechoslovakianDanishDelawareDominicanDutchDutch West IndianEastern EuropeanEcuadorianEgyptianEnglishEstonianEthiopianEuropeanFijianFilipinoFinnishFrenchFrench American IndianFrench CanadianGermanGerman RussianGhanaianGreekGuamanian/ChamorroGuatemalanGuyaneseHaitianHmongHonduranHopiHoumaHungarianIcelanderIndian (Asian)IndonesianInupiatIranianIraqiIrishIroquoisIsraeliItalianJamaicanJapaneseJordanianKenyanKiowaKoreanLaotianLatvianLebaneseLiberianLithuanianLumbeeLuxembourgerMacedonianMalaysianMalteseMarshalleseMenomineeMexicanMexican American IndianMongolianMoroccanNative HawaiianNavajoNepaleseNew ZealanderNicaraguanNigerianNorthern EuropeanNorwegianOkinawanOsageOttawaPaiutePakistaniPalestinianPanamanianParaguayanPennsylvania GermanPeruvianPimaPolishPortuguesePotawatomiPuebloPuerto RicanPuget Sound SalishRomanianRussianSalvadoranSamoanScandinavianScotch-IrishScottishSeminoleSenegaleseSerbianShoshoneSierra LeoneanSiouxSlavicSlovakSloveneSomaliSouth AfricanSouth AmericanSouth American IndianSoviet UnionSpaniardSpanishSpanish AmericanSpanish American IndianSri LankanSubsaharan AfricanSudaneseSwedishSwissSyrianTaiwaneseThaiTlingit-HaidaTohono O'OdhamTonganTrinidadian and TobagonianTsimshianTurkishU.S. Virgin IslanderUgandanUkrainianUruguayanUteVenezuelanVietnameseWelshWest IndianYakamaYaquiYugoslavianYumanYup'ikZimbabwean
Immigration
NonimmigrantsImmigrantsAfghanistanAfricaAlbaniaArgentinaArmeniaAsiaAustraliaAustriaBangladeshBarbadosBelarusBelgiumBelizeBoliviaBosnia and HerzegovinaBrazilBulgariaBurma/MyanmarCabo VerdeCambodiaCameroonCanadaCaribbeanCentral AmericaChileChinaColombiaCongoCosta RicaCroatiaCubaCzechoslovakiaDenmarkDominicaDominican RepublicEastern AfricaEastern AsiaEastern EuropeEcuadorEgyptEl SalvadorEnglandEritreaEthiopiaEuropeFijiFranceGermanyGhanaGreeceGrenadaGuatemalaGuyanaHaitiHondurasHong KongHungaryIndiaIndonesiaIranIraqIrelandIsraelItalyJamaicaJapanJordanKazakhstanKenyaKoreaKuwaitLaosLatin AmericaLatviaLebanonLiberiaLithuaniaMalaysiaMexicoMicronesiaMiddle AfricaMoldovaMoroccoNepalNetherlandsNicaraguaNigeriaNorth AmericaNorth MacedoniaNorthern AfricaNorthern EuropeNorwayOceaniaPakistanPanamaPeruPhilippinesPolandPortugalRomaniaRussiaSaudi ArabiaScotlandSenegalSerbiaSierra LeoneSingaporeSomaliaSouth AfricaSouth AmericaSouth Central AsiaSouth Eastern AsiaSouthern EuropeSpainSri LankaSt. Vincent and the GrenadinesSudanSwedenSwitzerlandSyriaTaiwanThailandTrinidad and TobagoTurkeyUgandaUkraineUruguayUzbekistanVenezuelaVietnamWest IndiesWestern AfricaWestern AsiaWestern EuropeYemenZaireZimbabweAzores
Master's Degree
Income
Poverty
Unemployment
Labor Participation
Family Structure
Vehicle Availability
Education Level
Disability

Master's Degree Comparison

Immigrants from Bahamas

French American Indians

Tragic
Tragic
12.9%
MASTER'S DEGREE
1.4/ 100
METRIC RATING
245th/ 347
METRIC RANK
12.7%
MASTER'S DEGREE
1.0/ 100
METRIC RATING
252nd/ 347
METRIC RANK

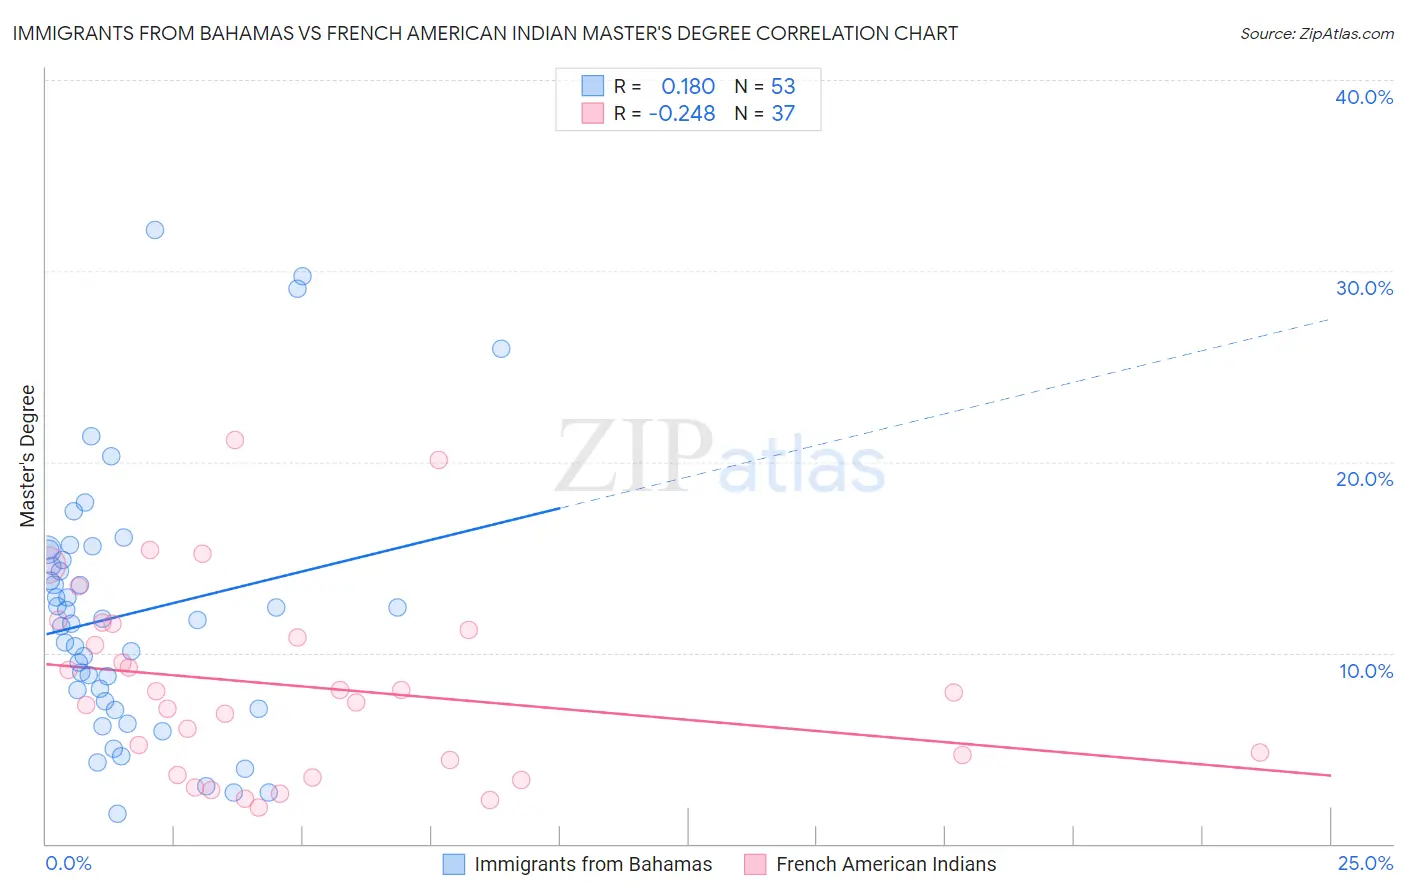
Immigrants from Bahamas vs French American Indian Master's Degree Correlation Chart

The statistical analysis conducted on geographies consisting of 104,646,319 people shows a poor positive correlation between the proportion of Immigrants from Bahamas and percentage of population with at least master's degree education in the United States with a correlation coefficient (R) of 0.180 and weighted average of 12.9%. Similarly, the statistical analysis conducted on geographies consisting of 131,966,823 people shows a weak negative correlation between the proportion of French American Indians and percentage of population with at least master's degree education in the United States with a correlation coefficient (R) of -0.248 and weighted average of 12.7%, a difference of 1.5%.
Immigrants from Bahamas vs French American Indian Master's Degree

Master's Degree Correlation Summary

MeasurementImmigrants from BahamasFrench American Indian
Minimum1.6%1.9%
Maximum32.1%21.1%
Range30.6%19.2%
Mean12.0%8.3%
Median11.7%7.9%
Interquartile 25% (IQ1)7.3%4.0%
Interquartile 75% (IQ3)15.1%11.4%
Interquartile Range (IQR)7.9%7.4%
Standard Deviation (Sample)6.7%4.9%
Standard Deviation (Population)6.7%4.8%

Demographics Similar to Immigrants from Bahamas and French American Indians by Master's Degree

In terms of master's degree, the demographic groups most similar to Immigrants from Bahamas are Immigrants from Cambodia (12.9%, a difference of 0.040%), Iroquois (12.9%, a difference of 0.070%), African (12.9%, a difference of 0.16%), Cree (12.8%, a difference of 0.47%), and Liberian (12.8%, a difference of 0.47%). Similarly, the demographic groups most similar to French American Indians are Immigrants from Dominica (12.6%, a difference of 0.54%), Indonesian (12.6%, a difference of 0.59%), Immigrants from Congo (12.6%, a difference of 0.61%), Immigrants from Portugal (12.6%, a difference of 0.69%), and Tlingit-Haida (12.8%, a difference of 0.98%).
DemographicsRating | RankMaster's Degree
Hmong
4.0
/100
|
#238
Tragic
13.4%
Immigrants | Nonimmigrants
3.4
/100
|
#239
Tragic
13.3%
Guamanians/Chamorros
2.2
/100
|
#240
Tragic
13.1%
U.S. Virgin Islanders
2.1
/100
|
#241
Tragic
13.1%
Spanish Americans
1.9
/100
|
#242
Tragic
13.0%
Immigrants | Jamaica
1.9
/100
|
#243
Tragic
13.0%
Delaware
1.7
/100
|
#244
Tragic
13.0%
Immigrants | Bahamas
1.4
/100
|
#245
Tragic
12.9%
Immigrants | Cambodia
1.4
/100
|
#246
Tragic
12.9%
Iroquois
1.4
/100
|
#247
Tragic
12.9%
Africans
1.4
/100
|
#248
Tragic
12.9%
Cree
1.3
/100
|
#249
Tragic
12.8%
Liberians
1.3
/100
|
#250
Tragic
12.8%
Tlingit-Haida
1.3
/100
|
#251
Tragic
12.8%
French American Indians
1.0
/100
|
#252
Tragic
12.7%
Immigrants | Dominica
0.8
/100
|
#253
Tragic
12.6%
Indonesians
0.8
/100
|
#254
Tragic
12.6%
Immigrants | Congo
0.8
/100
|
#255
Tragic
12.6%
Immigrants | Portugal
0.8
/100
|
#256
Tragic
12.6%
Osage
0.7
/100
|
#257
Tragic
12.6%
Immigrants | Liberia
0.6
/100
|
#258
Tragic
12.5%