Immigrants from Dominica vs Bulgarian Bachelor's Degree
COMPARE
Immigrants from Dominica
Bulgarian
Bachelor's Degree
Bachelor's Degree Comparison
Immigrants from Dominica
Bulgarians
32.5%
BACHELOR'S DEGREE
0.3/ 100
METRIC RATING
266th/ 347
METRIC RANK
45.3%
BACHELOR'S DEGREE
100.0/ 100
METRIC RATING
38th/ 347
METRIC RANK
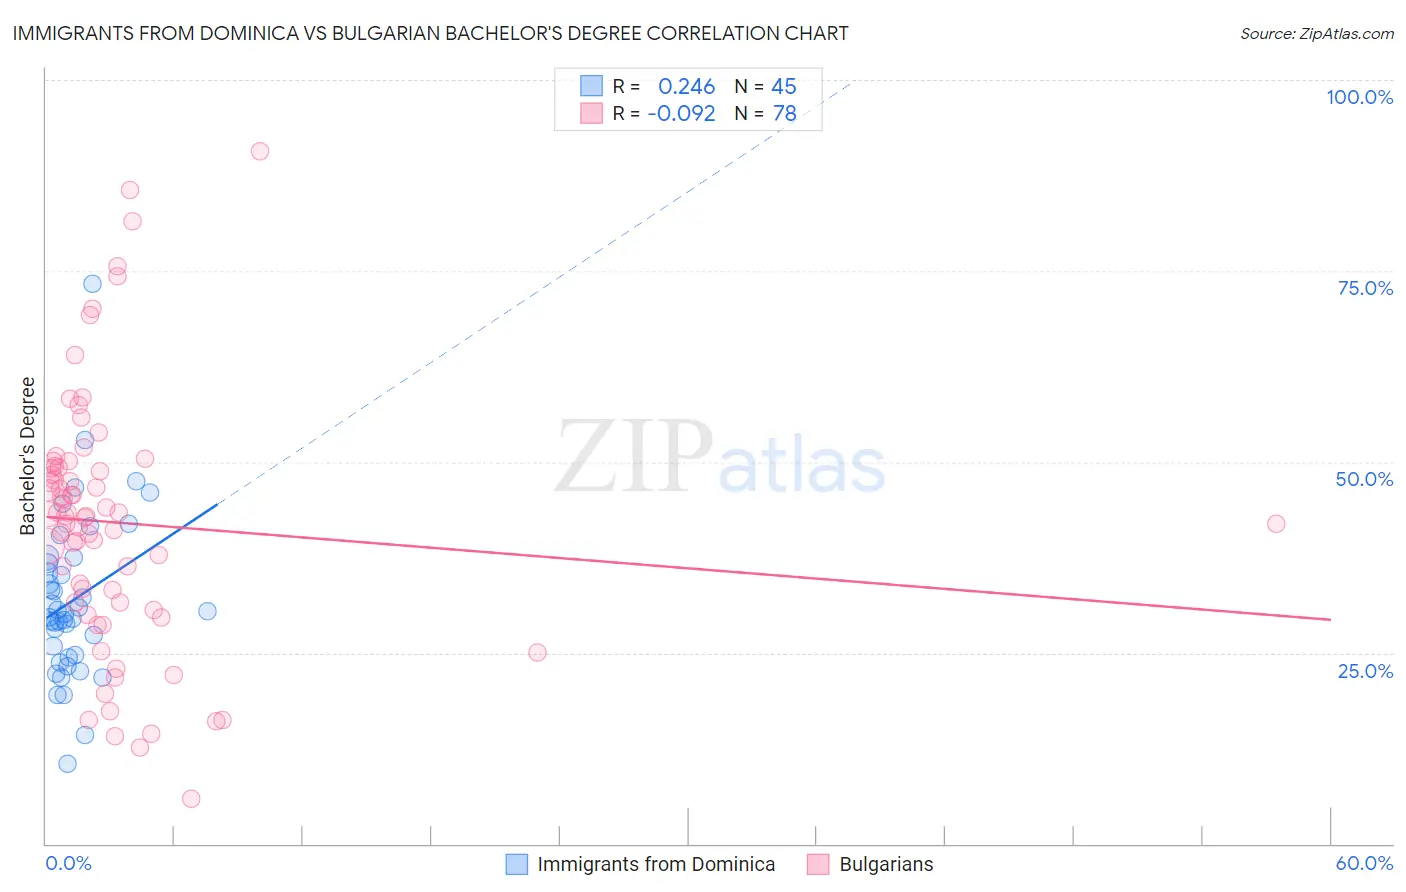
Immigrants from Dominica vs Bulgarian Bachelor's Degree Correlation Chart
The statistical analysis conducted on geographies consisting of 83,795,636 people shows a weak positive correlation between the proportion of Immigrants from Dominica and percentage of population with at least bachelor's degree education in the United States with a correlation coefficient (R) of 0.246 and weighted average of 32.5%. Similarly, the statistical analysis conducted on geographies consisting of 205,616,676 people shows a slight negative correlation between the proportion of Bulgarians and percentage of population with at least bachelor's degree education in the United States with a correlation coefficient (R) of -0.092 and weighted average of 45.3%, a difference of 39.3%.
Bachelor's Degree Correlation Summary
| Measurement | Immigrants from Dominica | Bulgarian |
| Minimum | 10.5% | 5.9% |
| Maximum | 73.4% | 90.7% |
| Range | 62.9% | 84.8% |
| Mean | 31.9% | 42.0% |
| Median | 30.1% | 42.9% |
| Interquartile 25% (IQ1) | 24.6% | 31.5% |
| Interquartile 75% (IQ3) | 37.1% | 49.3% |
| Interquartile Range (IQR) | 12.5% | 17.7% |
| Standard Deviation (Sample) | 10.9% | 16.8% |
| Standard Deviation (Population) | 10.7% | 16.7% |
Similar Demographics by Bachelor's Degree
Demographics Similar to Immigrants from Dominica by Bachelor's Degree
In terms of bachelor's degree, the demographic groups most similar to Immigrants from Dominica are Bahamian (32.5%, a difference of 0.030%), Central American Indian (32.5%, a difference of 0.060%), Cuban (32.5%, a difference of 0.12%), Belizean (32.8%, a difference of 0.84%), and Immigrants from Portugal (32.2%, a difference of 0.88%).
| Demographics | Rating | Rank | Bachelor's Degree |
| Osage | 0.5 /100 | #259 | Tragic 33.0% |
| Malaysians | 0.5 /100 | #260 | Tragic 32.9% |
| Africans | 0.5 /100 | #261 | Tragic 32.9% |
| Immigrants | Jamaica | 0.5 /100 | #262 | Tragic 32.9% |
| Belizeans | 0.4 /100 | #263 | Tragic 32.8% |
| Central American Indians | 0.3 /100 | #264 | Tragic 32.5% |
| Bahamians | 0.3 /100 | #265 | Tragic 32.5% |
| Immigrants | Dominica | 0.3 /100 | #266 | Tragic 32.5% |
| Cubans | 0.3 /100 | #267 | Tragic 32.5% |
| Immigrants | Portugal | 0.2 /100 | #268 | Tragic 32.2% |
| Immigrants | Belize | 0.2 /100 | #269 | Tragic 32.1% |
| Immigrants | Nicaragua | 0.2 /100 | #270 | Tragic 31.9% |
| Central Americans | 0.2 /100 | #271 | Tragic 31.9% |
| Comanche | 0.2 /100 | #272 | Tragic 31.9% |
| Americans | 0.2 /100 | #273 | Tragic 31.9% |
Demographics Similar to Bulgarians by Bachelor's Degree
In terms of bachelor's degree, the demographic groups most similar to Bulgarians are Russian (45.3%, a difference of 0.090%), Mongolian (45.4%, a difference of 0.24%), Immigrants from Russia (45.4%, a difference of 0.26%), Immigrants from Denmark (45.4%, a difference of 0.28%), and Immigrants from Latvia (45.1%, a difference of 0.33%).
| Demographics | Rating | Rank | Bachelor's Degree |
| Latvians | 100.0 /100 | #31 | Exceptional 46.1% |
| Immigrants | Turkey | 100.0 /100 | #32 | Exceptional 46.0% |
| Immigrants | Northern Europe | 100.0 /100 | #33 | Exceptional 45.6% |
| Immigrants | Denmark | 100.0 /100 | #34 | Exceptional 45.4% |
| Immigrants | Russia | 100.0 /100 | #35 | Exceptional 45.4% |
| Mongolians | 100.0 /100 | #36 | Exceptional 45.4% |
| Russians | 100.0 /100 | #37 | Exceptional 45.3% |
| Bulgarians | 100.0 /100 | #38 | Exceptional 45.3% |
| Immigrants | Latvia | 100.0 /100 | #39 | Exceptional 45.1% |
| Immigrants | Belarus | 100.0 /100 | #40 | Exceptional 45.0% |
| Immigrants | Malaysia | 100.0 /100 | #41 | Exceptional 45.0% |
| Immigrants | Saudi Arabia | 100.0 /100 | #42 | Exceptional 44.8% |
| Immigrants | South Africa | 99.9 /100 | #43 | Exceptional 44.8% |
| Immigrants | Lithuania | 99.9 /100 | #44 | Exceptional 44.6% |
| Immigrants | Kuwait | 99.9 /100 | #45 | Exceptional 44.6% |