Immigrants from Asia vs Carpatho Rusyn Single Father Households
COMPARE
Immigrants from Asia
Carpatho Rusyn
Single Father Households
Single Father Households Comparison
Immigrants from Asia
Carpatho Rusyns
2.1%
SINGLE FATHER HOUSEHOLDS
99.7/ 100
METRIC RATING
79th/ 347
METRIC RANK
2.1%
SINGLE FATHER HOUSEHOLDS
99.6/ 100
METRIC RATING
84th/ 347
METRIC RANK
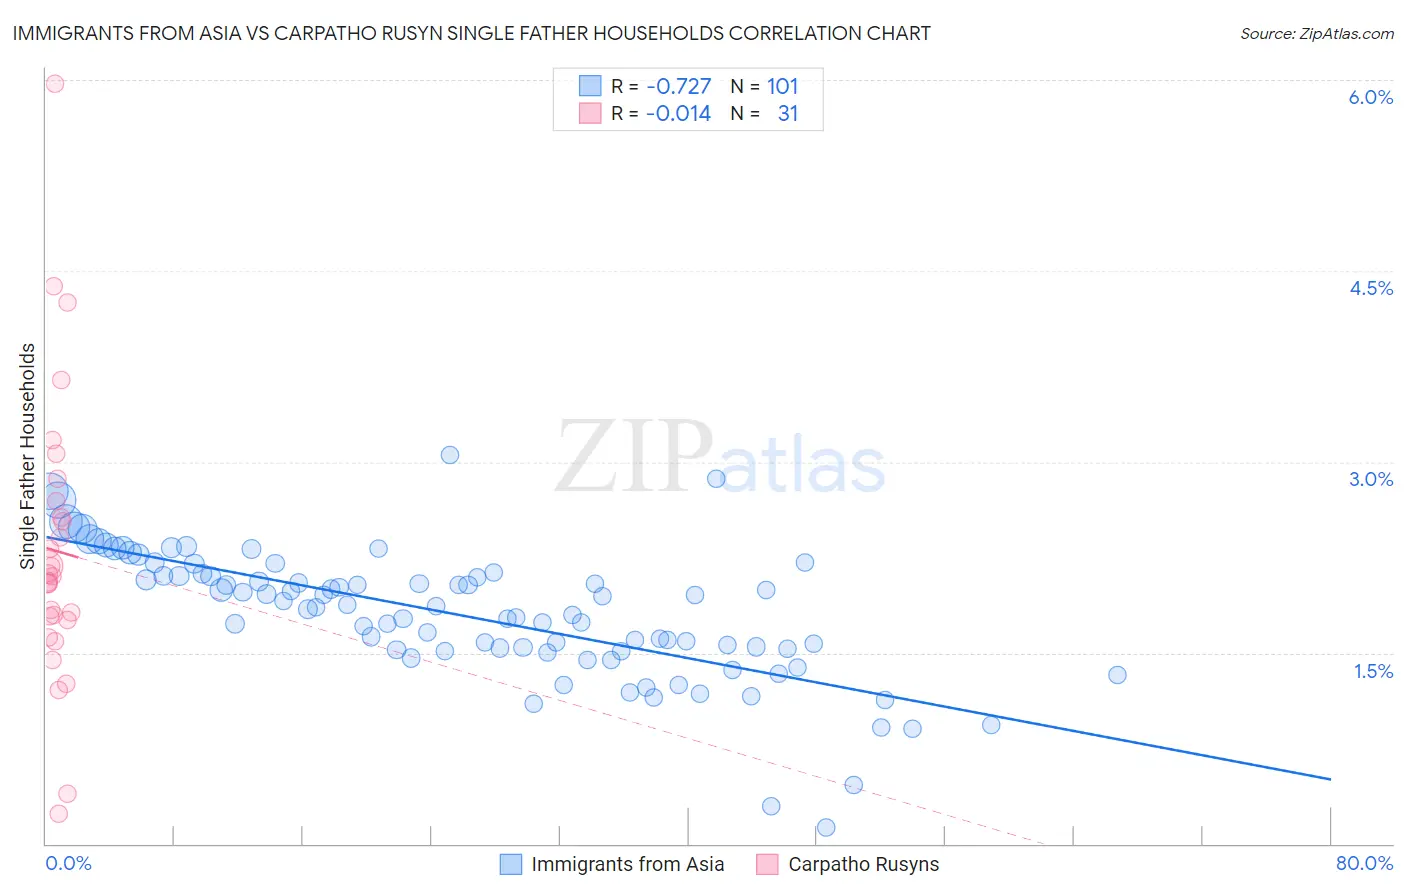
Immigrants from Asia vs Carpatho Rusyn Single Father Households Correlation Chart
The statistical analysis conducted on geographies consisting of 538,286,555 people shows a strong negative correlation between the proportion of Immigrants from Asia and percentage of single father households in the United States with a correlation coefficient (R) of -0.727 and weighted average of 2.1%. Similarly, the statistical analysis conducted on geographies consisting of 58,690,125 people shows no correlation between the proportion of Carpatho Rusyns and percentage of single father households in the United States with a correlation coefficient (R) of -0.014 and weighted average of 2.1%, a difference of 0.53%.
Single Father Households Correlation Summary
| Measurement | Immigrants from Asia | Carpatho Rusyn |
| Minimum | 0.13% | 0.23% |
| Maximum | 3.1% | 6.0% |
| Range | 2.9% | 5.7% |
| Mean | 1.8% | 2.3% |
| Median | 1.9% | 2.1% |
| Interquartile 25% (IQ1) | 1.5% | 1.8% |
| Interquartile 75% (IQ3) | 2.1% | 2.7% |
| Interquartile Range (IQR) | 0.59% | 0.93% |
| Standard Deviation (Sample) | 0.51% | 1.1% |
| Standard Deviation (Population) | 0.51% | 1.1% |
Demographics Similar to Immigrants from Asia and Carpatho Rusyns by Single Father Households
In terms of single father households, the demographic groups most similar to Immigrants from Asia are Immigrants from South Africa (2.1%, a difference of 0.090%), Estonian (2.1%, a difference of 0.11%), Armenian (2.1%, a difference of 0.17%), New Zealander (2.1%, a difference of 0.22%), and Greek (2.1%, a difference of 0.23%). Similarly, the demographic groups most similar to Carpatho Rusyns are Immigrants from Hungary (2.1%, a difference of 0.040%), Asian (2.1%, a difference of 0.12%), Greek (2.1%, a difference of 0.30%), New Zealander (2.1%, a difference of 0.31%), and Armenian (2.1%, a difference of 0.36%).
| Demographics | Rating | Rank | Single Father Households |
| Immigrants | Kuwait | 99.8 /100 | #71 | Exceptional 2.1% |
| Immigrants | Spain | 99.8 /100 | #72 | Exceptional 2.1% |
| Immigrants | Bangladesh | 99.8 /100 | #73 | Exceptional 2.1% |
| Immigrants | Egypt | 99.8 /100 | #74 | Exceptional 2.1% |
| Immigrants | Sweden | 99.8 /100 | #75 | Exceptional 2.1% |
| Immigrants | Scotland | 99.8 /100 | #76 | Exceptional 2.1% |
| Immigrants | Saudi Arabia | 99.8 /100 | #77 | Exceptional 2.1% |
| Estonians | 99.7 /100 | #78 | Exceptional 2.1% |
| Immigrants | Asia | 99.7 /100 | #79 | Exceptional 2.1% |
| Immigrants | South Africa | 99.7 /100 | #80 | Exceptional 2.1% |
| Armenians | 99.7 /100 | #81 | Exceptional 2.1% |
| New Zealanders | 99.7 /100 | #82 | Exceptional 2.1% |
| Greeks | 99.7 /100 | #83 | Exceptional 2.1% |
| Carpatho Rusyns | 99.6 /100 | #84 | Exceptional 2.1% |
| Immigrants | Hungary | 99.6 /100 | #85 | Exceptional 2.1% |
| Asians | 99.6 /100 | #86 | Exceptional 2.1% |
| Lithuanians | 99.5 /100 | #87 | Exceptional 2.1% |
| Bhutanese | 99.5 /100 | #88 | Exceptional 2.1% |
| Immigrants | Armenia | 99.5 /100 | #89 | Exceptional 2.1% |
| Immigrants | Pakistan | 99.5 /100 | #90 | Exceptional 2.1% |
| Immigrants | Guyana | 99.4 /100 | #91 | Exceptional 2.1% |