Immigrants from Asia vs Immigrants from Netherlands Doctorate Degree
COMPARE
Immigrants from Asia
Immigrants from Netherlands
Doctorate Degree
Doctorate Degree Comparison
Immigrants from Asia
Immigrants from Netherlands
2.4%
DOCTORATE DEGREE
100.0/ 100
METRIC RATING
49th/ 347
METRIC RANK
2.5%
DOCTORATE DEGREE
100.0/ 100
METRIC RATING
44th/ 347
METRIC RANK
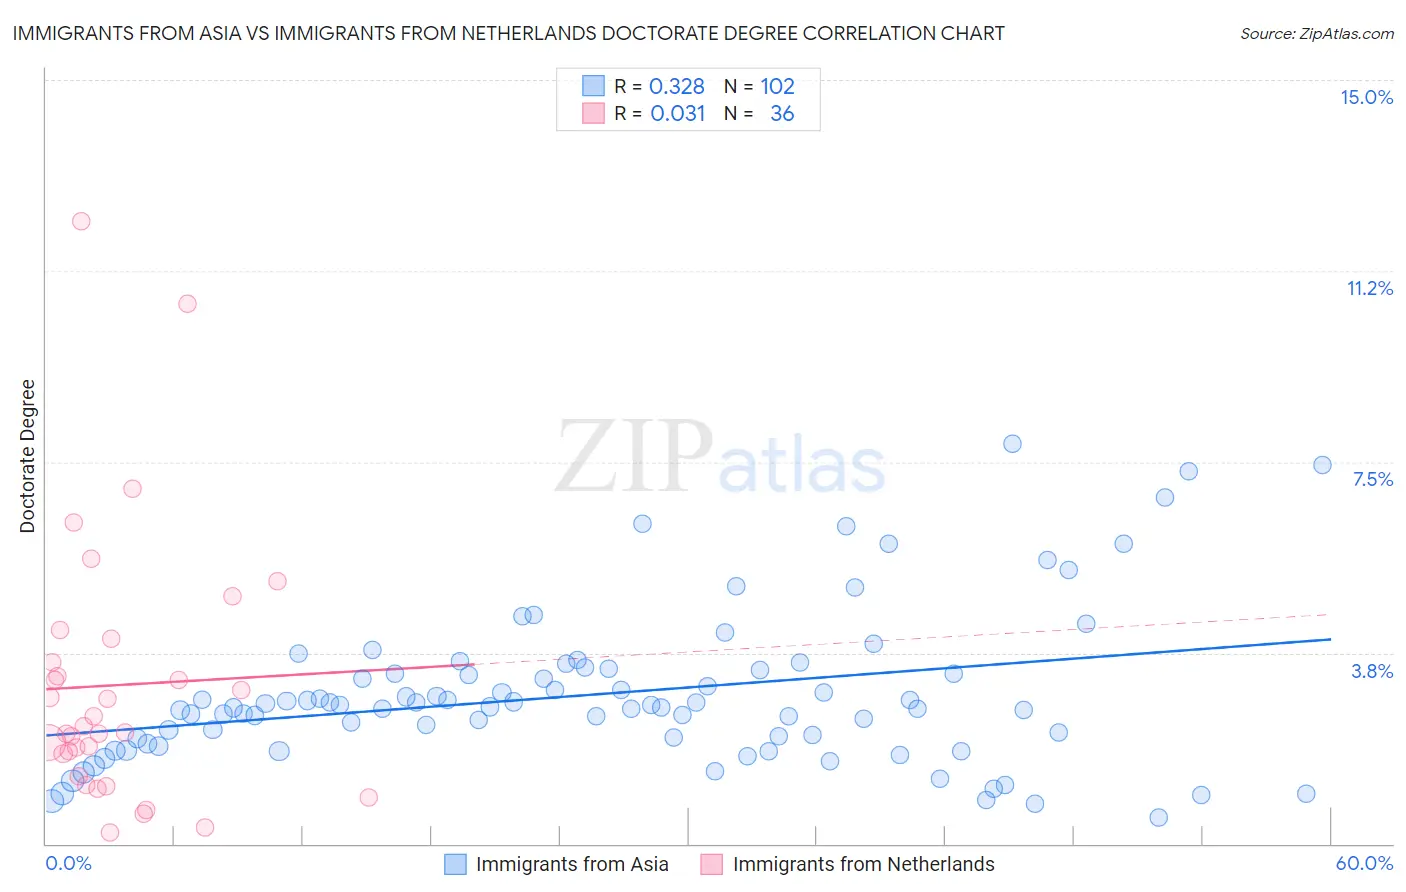
Immigrants from Asia vs Immigrants from Netherlands Doctorate Degree Correlation Chart
The statistical analysis conducted on geographies consisting of 533,403,409 people shows a mild positive correlation between the proportion of Immigrants from Asia and percentage of population with at least doctorate degree education in the United States with a correlation coefficient (R) of 0.328 and weighted average of 2.4%. Similarly, the statistical analysis conducted on geographies consisting of 236,893,831 people shows no correlation between the proportion of Immigrants from Netherlands and percentage of population with at least doctorate degree education in the United States with a correlation coefficient (R) of 0.031 and weighted average of 2.5%, a difference of 2.2%.
Doctorate Degree Correlation Summary
| Measurement | Immigrants from Asia | Immigrants from Netherlands |
| Minimum | 0.51% | 0.21% |
| Maximum | 7.9% | 12.2% |
| Range | 7.4% | 12.0% |
| Mean | 2.9% | 3.1% |
| Median | 2.7% | 2.3% |
| Interquartile 25% (IQ1) | 2.1% | 1.5% |
| Interquartile 75% (IQ3) | 3.4% | 3.8% |
| Interquartile Range (IQR) | 1.3% | 2.2% |
| Standard Deviation (Sample) | 1.5% | 2.6% |
| Standard Deviation (Population) | 1.5% | 2.6% |
Demographics Similar to Immigrants from Asia and Immigrants from Netherlands by Doctorate Degree
In terms of doctorate degree, the demographic groups most similar to Immigrants from Asia are Asian (2.4%, a difference of 0.13%), Immigrants from Western Europe (2.4%, a difference of 0.34%), Immigrants from Austria (2.4%, a difference of 0.57%), Immigrants from South Africa (2.4%, a difference of 0.70%), and Immigrants from Norway (2.4%, a difference of 1.1%). Similarly, the demographic groups most similar to Immigrants from Netherlands are Soviet Union (2.5%, a difference of 0.040%), New Zealander (2.5%, a difference of 0.97%), Immigrants from South Africa (2.4%, a difference of 1.5%), Immigrants from Russia (2.5%, a difference of 1.6%), and Immigrants from Austria (2.4%, a difference of 1.7%).
| Demographics | Rating | Rank | Doctorate Degree |
| Immigrants | Spain | 100.0 /100 | #36 | Exceptional 2.6% |
| Immigrants | Kuwait | 100.0 /100 | #37 | Exceptional 2.6% |
| Russians | 100.0 /100 | #38 | Exceptional 2.6% |
| Immigrants | Ireland | 100.0 /100 | #39 | Exceptional 2.5% |
| Estonians | 100.0 /100 | #40 | Exceptional 2.5% |
| Immigrants | Russia | 100.0 /100 | #41 | Exceptional 2.5% |
| New Zealanders | 100.0 /100 | #42 | Exceptional 2.5% |
| Soviet Union | 100.0 /100 | #43 | Exceptional 2.5% |
| Immigrants | Netherlands | 100.0 /100 | #44 | Exceptional 2.5% |
| Immigrants | South Africa | 100.0 /100 | #45 | Exceptional 2.4% |
| Immigrants | Austria | 100.0 /100 | #46 | Exceptional 2.4% |
| Immigrants | Western Europe | 100.0 /100 | #47 | Exceptional 2.4% |
| Asians | 100.0 /100 | #48 | Exceptional 2.4% |
| Immigrants | Asia | 100.0 /100 | #49 | Exceptional 2.4% |
| Immigrants | Norway | 100.0 /100 | #50 | Exceptional 2.4% |
| Australians | 100.0 /100 | #51 | Exceptional 2.4% |
| Bulgarians | 100.0 /100 | #52 | Exceptional 2.4% |
| Immigrants | Latvia | 100.0 /100 | #53 | Exceptional 2.4% |
| Immigrants | Indonesia | 100.0 /100 | #54 | Exceptional 2.4% |
| Bolivians | 100.0 /100 | #55 | Exceptional 2.4% |
| Immigrants | Czechoslovakia | 100.0 /100 | #56 | Exceptional 2.4% |