Immigrants from Armenia vs Immigrants from Western Africa 1st Grade
COMPARE
Immigrants from Armenia
Immigrants from Western Africa
1st Grade
1st Grade Comparison
Immigrants from Armenia
Immigrants from Western Africa
96.6%
1ST GRADE
0.0/ 100
METRIC RATING
331st/ 347
METRIC RANK
97.4%
1ST GRADE
0.1/ 100
METRIC RATING
277th/ 347
METRIC RANK
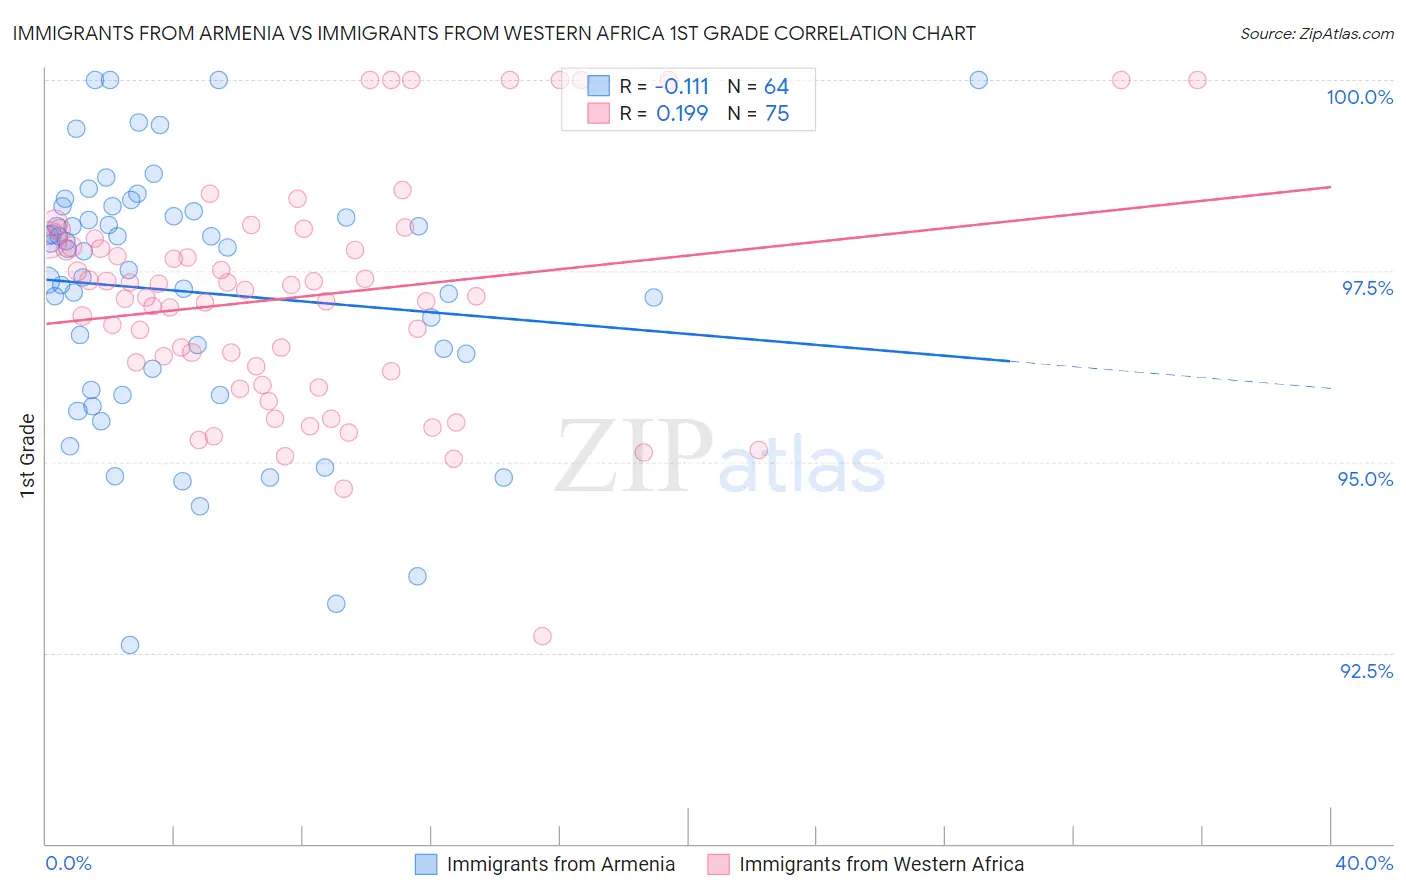
Immigrants from Armenia vs Immigrants from Western Africa 1st Grade Correlation Chart
The statistical analysis conducted on geographies consisting of 97,725,276 people shows a poor negative correlation between the proportion of Immigrants from Armenia and percentage of population with at least 1st grade education in the United States with a correlation coefficient (R) of -0.111 and weighted average of 96.6%. Similarly, the statistical analysis conducted on geographies consisting of 357,811,354 people shows a poor positive correlation between the proportion of Immigrants from Western Africa and percentage of population with at least 1st grade education in the United States with a correlation coefficient (R) of 0.199 and weighted average of 97.4%, a difference of 0.82%.
1st Grade Correlation Summary
| Measurement | Immigrants from Armenia | Immigrants from Western Africa |
| Minimum | 92.6% | 92.7% |
| Maximum | 100.0% | 100.0% |
| Range | 7.4% | 7.3% |
| Mean | 97.2% | 97.2% |
| Median | 97.8% | 97.2% |
| Interquartile 25% (IQ1) | 96.1% | 96.2% |
| Interquartile 75% (IQ3) | 98.2% | 97.9% |
| Interquartile Range (IQR) | 2.2% | 1.7% |
| Standard Deviation (Sample) | 1.7% | 1.5% |
| Standard Deviation (Population) | 1.7% | 1.5% |
Similar Demographics by 1st Grade
Demographics Similar to Immigrants from Armenia by 1st Grade
In terms of 1st grade, the demographic groups most similar to Immigrants from Armenia are Immigrants from Vietnam (96.6%, a difference of 0.020%), Japanese (96.6%, a difference of 0.030%), Central American (96.5%, a difference of 0.050%), Immigrants from Dominican Republic (96.5%, a difference of 0.060%), and Bangladeshi (96.5%, a difference of 0.060%).
| Demographics | Rating | Rank | 1st Grade |
| Vietnamese | 0.0 /100 | #324 | Tragic 96.8% |
| Dominicans | 0.0 /100 | #325 | Tragic 96.7% |
| Indonesians | 0.0 /100 | #326 | Tragic 96.7% |
| Mexicans | 0.0 /100 | #327 | Tragic 96.7% |
| Immigrants | Latin America | 0.0 /100 | #328 | Tragic 96.7% |
| Japanese | 0.0 /100 | #329 | Tragic 96.6% |
| Immigrants | Vietnam | 0.0 /100 | #330 | Tragic 96.6% |
| Immigrants | Armenia | 0.0 /100 | #331 | Tragic 96.6% |
| Central Americans | 0.0 /100 | #332 | Tragic 96.5% |
| Immigrants | Dominican Republic | 0.0 /100 | #333 | Tragic 96.5% |
| Bangladeshis | 0.0 /100 | #334 | Tragic 96.5% |
| Yakama | 0.0 /100 | #335 | Tragic 96.5% |
| Guatemalans | 0.0 /100 | #336 | Tragic 96.5% |
| Immigrants | Cambodia | 0.0 /100 | #337 | Tragic 96.5% |
| Immigrants | Fiji | 0.0 /100 | #338 | Tragic 96.4% |
Demographics Similar to Immigrants from Western Africa by 1st Grade
In terms of 1st grade, the demographic groups most similar to Immigrants from Western Africa are Immigrants from Philippines (97.4%, a difference of 0.010%), Immigrants from China (97.4%, a difference of 0.020%), Immigrants from Uzbekistan (97.4%, a difference of 0.020%), Immigrants from Ghana (97.4%, a difference of 0.020%), and Ghanaian (97.4%, a difference of 0.030%).
| Demographics | Rating | Rank | 1st Grade |
| Immigrants | Jamaica | 0.2 /100 | #270 | Tragic 97.5% |
| Immigrants | Cameroon | 0.2 /100 | #271 | Tragic 97.4% |
| Immigrants | Peru | 0.2 /100 | #272 | Tragic 97.4% |
| Immigrants | Bolivia | 0.2 /100 | #273 | Tragic 97.4% |
| Ghanaians | 0.1 /100 | #274 | Tragic 97.4% |
| Immigrants | China | 0.1 /100 | #275 | Tragic 97.4% |
| Immigrants | Philippines | 0.1 /100 | #276 | Tragic 97.4% |
| Immigrants | Western Africa | 0.1 /100 | #277 | Tragic 97.4% |
| Immigrants | Uzbekistan | 0.1 /100 | #278 | Tragic 97.4% |
| Immigrants | Ghana | 0.1 /100 | #279 | Tragic 97.4% |
| Afghans | 0.1 /100 | #280 | Tragic 97.4% |
| Trinidadians and Tobagonians | 0.1 /100 | #281 | Tragic 97.3% |
| Barbadians | 0.1 /100 | #282 | Tragic 97.3% |
| Immigrants | West Indies | 0.0 /100 | #283 | Tragic 97.3% |
| Immigrants | Trinidad and Tobago | 0.0 /100 | #284 | Tragic 97.3% |