Immigrants from Africa vs Native/Alaskan Doctorate Degree
COMPARE
Immigrants from Africa
Native/Alaskan
Doctorate Degree
Doctorate Degree Comparison
Immigrants from Africa
Natives/Alaskans
2.0%
DOCTORATE DEGREE
87.0/ 100
METRIC RATING
140th/ 347
METRIC RANK
1.3%
DOCTORATE DEGREE
0.0/ 100
METRIC RATING
324th/ 347
METRIC RANK
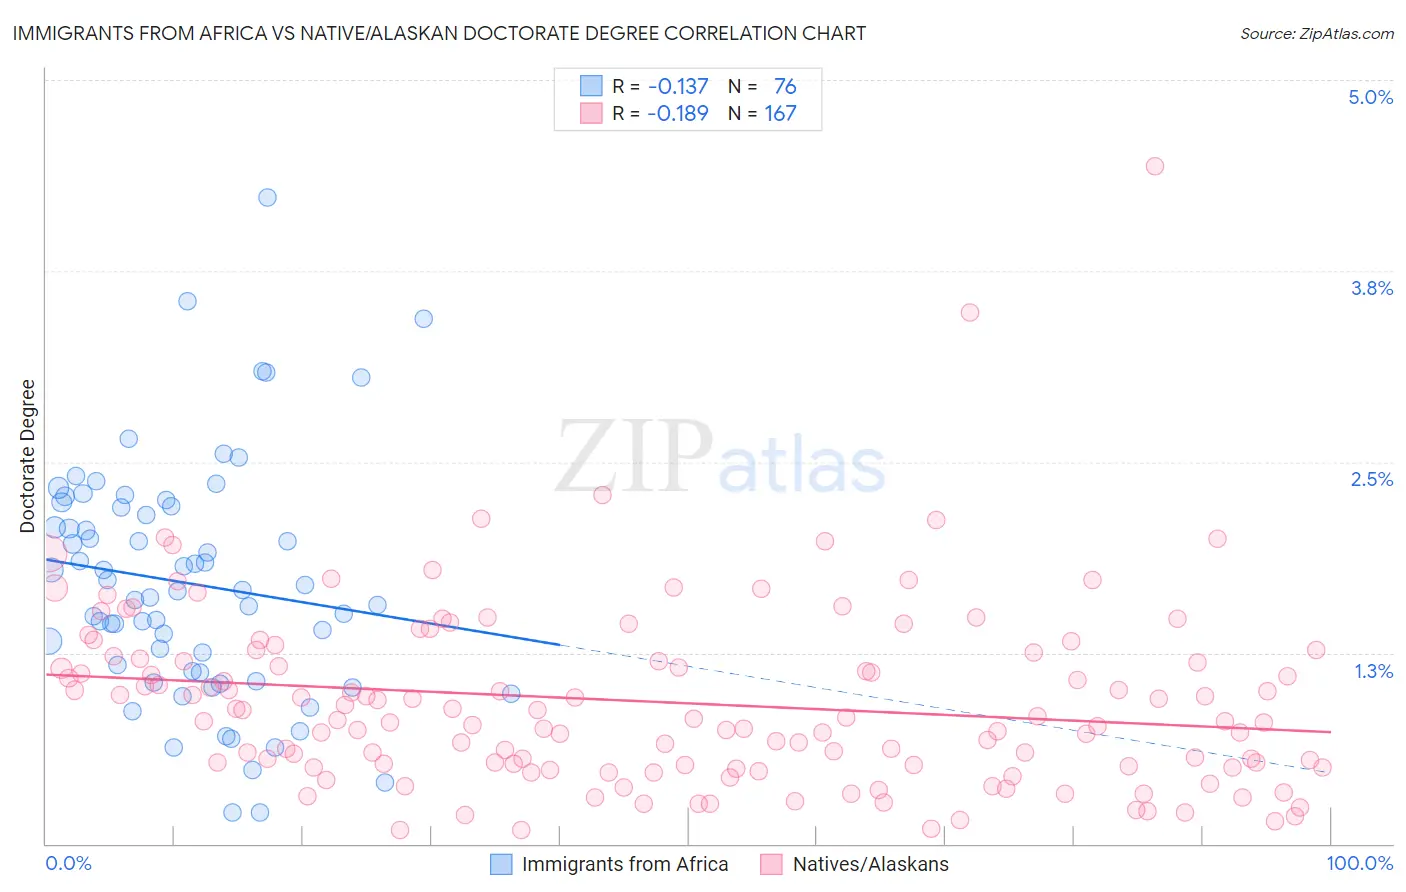
Immigrants from Africa vs Native/Alaskan Doctorate Degree Correlation Chart
The statistical analysis conducted on geographies consisting of 463,247,736 people shows a poor negative correlation between the proportion of Immigrants from Africa and percentage of population with at least doctorate degree education in the United States with a correlation coefficient (R) of -0.137 and weighted average of 2.0%. Similarly, the statistical analysis conducted on geographies consisting of 497,415,117 people shows a poor negative correlation between the proportion of Natives/Alaskans and percentage of population with at least doctorate degree education in the United States with a correlation coefficient (R) of -0.189 and weighted average of 1.3%, a difference of 48.5%.
Doctorate Degree Correlation Summary
| Measurement | Immigrants from Africa | Native/Alaskan |
| Minimum | 0.20% | 0.087% |
| Maximum | 4.2% | 4.4% |
| Range | 4.0% | 4.3% |
| Mean | 1.7% | 0.93% |
| Median | 1.7% | 0.81% |
| Interquartile 25% (IQ1) | 1.1% | 0.51% |
| Interquartile 75% (IQ3) | 2.2% | 1.2% |
| Interquartile Range (IQR) | 1.1% | 0.72% |
| Standard Deviation (Sample) | 0.78% | 0.60% |
| Standard Deviation (Population) | 0.77% | 0.60% |
Similar Demographics by Doctorate Degree
Demographics Similar to Immigrants from Africa by Doctorate Degree
In terms of doctorate degree, the demographic groups most similar to Immigrants from Africa are Senegalese (2.0%, a difference of 0.070%), Afghan (2.0%, a difference of 0.080%), Italian (2.0%, a difference of 0.28%), Swiss (2.0%, a difference of 0.31%), and South American Indian (2.0%, a difference of 0.40%).
| Demographics | Rating | Rank | Doctorate Degree |
| Immigrants | Uzbekistan | 89.3 /100 | #133 | Excellent 2.0% |
| Immigrants | Cameroon | 88.9 /100 | #134 | Excellent 2.0% |
| Serbians | 88.7 /100 | #135 | Excellent 2.0% |
| Swedes | 88.3 /100 | #136 | Excellent 2.0% |
| South American Indians | 88.3 /100 | #137 | Excellent 2.0% |
| Swiss | 88.0 /100 | #138 | Excellent 2.0% |
| Afghans | 87.2 /100 | #139 | Excellent 2.0% |
| Immigrants | Africa | 87.0 /100 | #140 | Excellent 2.0% |
| Senegalese | 86.7 /100 | #141 | Excellent 2.0% |
| Italians | 86.0 /100 | #142 | Excellent 2.0% |
| Sierra Leoneans | 85.1 /100 | #143 | Excellent 2.0% |
| Immigrants | Moldova | 84.3 /100 | #144 | Excellent 2.0% |
| Kenyans | 83.6 /100 | #145 | Excellent 1.9% |
| Immigrants | Syria | 83.6 /100 | #146 | Excellent 1.9% |
| Immigrants | Senegal | 82.5 /100 | #147 | Excellent 1.9% |
Demographics Similar to Natives/Alaskans by Doctorate Degree
In terms of doctorate degree, the demographic groups most similar to Natives/Alaskans are Immigrants from Belize (1.3%, a difference of 0.32%), Pima (1.3%, a difference of 0.39%), Immigrants from Cabo Verde (1.3%, a difference of 0.41%), Seminole (1.3%, a difference of 0.52%), and Dutch West Indian (1.3%, a difference of 0.58%).
| Demographics | Rating | Rank | Doctorate Degree |
| Immigrants | Micronesia | 0.1 /100 | #317 | Tragic 1.3% |
| Creek | 0.1 /100 | #318 | Tragic 1.3% |
| Immigrants | Guyana | 0.1 /100 | #319 | Tragic 1.3% |
| Immigrants | St. Vincent and the Grenadines | 0.1 /100 | #320 | Tragic 1.3% |
| Dutch West Indians | 0.1 /100 | #321 | Tragic 1.3% |
| Seminole | 0.1 /100 | #322 | Tragic 1.3% |
| Immigrants | Belize | 0.1 /100 | #323 | Tragic 1.3% |
| Natives/Alaskans | 0.0 /100 | #324 | Tragic 1.3% |
| Pima | 0.0 /100 | #325 | Tragic 1.3% |
| Immigrants | Cabo Verde | 0.0 /100 | #326 | Tragic 1.3% |
| Hispanics or Latinos | 0.0 /100 | #327 | Tragic 1.3% |
| Inupiat | 0.0 /100 | #328 | Tragic 1.3% |
| Haitians | 0.0 /100 | #329 | Tragic 1.3% |
| Yup'ik | 0.0 /100 | #330 | Tragic 1.3% |
| Immigrants | Latin America | 0.0 /100 | #331 | Tragic 1.3% |