Yup'ik vs Native/Alaskan Doctorate Degree
COMPARE
Yup'ik
Native/Alaskan
Doctorate Degree
Doctorate Degree Comparison
Yup'ik
Natives/Alaskans
1.3%
DOCTORATE DEGREE
0.0/ 100
METRIC RATING
330th/ 347
METRIC RANK
1.3%
DOCTORATE DEGREE
0.0/ 100
METRIC RATING
324th/ 347
METRIC RANK
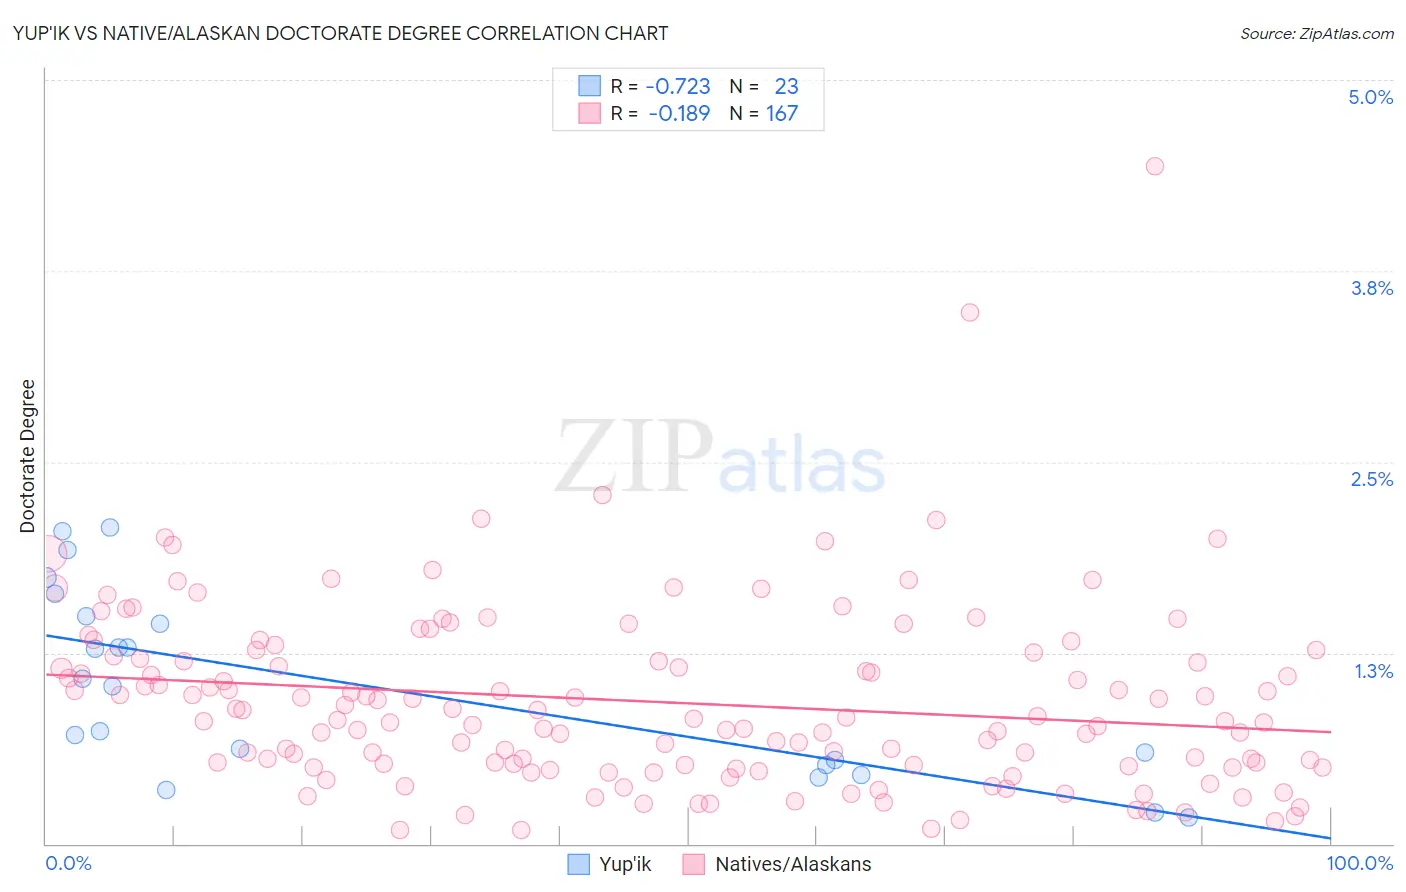
Yup'ik vs Native/Alaskan Doctorate Degree Correlation Chart
The statistical analysis conducted on geographies consisting of 39,714,218 people shows a strong negative correlation between the proportion of Yup'ik and percentage of population with at least doctorate degree education in the United States with a correlation coefficient (R) of -0.723 and weighted average of 1.3%. Similarly, the statistical analysis conducted on geographies consisting of 497,415,117 people shows a poor negative correlation between the proportion of Natives/Alaskans and percentage of population with at least doctorate degree education in the United States with a correlation coefficient (R) of -0.189 and weighted average of 1.3%, a difference of 1.6%.
Doctorate Degree Correlation Summary
| Measurement | Yup'ik | Native/Alaskan |
| Minimum | 0.17% | 0.087% |
| Maximum | 2.1% | 4.4% |
| Range | 1.9% | 4.3% |
| Mean | 1.0% | 0.93% |
| Median | 1.0% | 0.81% |
| Interquartile 25% (IQ1) | 0.51% | 0.51% |
| Interquartile 75% (IQ3) | 1.5% | 1.2% |
| Interquartile Range (IQR) | 0.97% | 0.72% |
| Standard Deviation (Sample) | 0.60% | 0.60% |
| Standard Deviation (Population) | 0.59% | 0.60% |
Demographics Similar to Yup'ik and Natives/Alaskans by Doctorate Degree
In terms of doctorate degree, the demographic groups most similar to Yup'ik are Immigrants from Latin America (1.3%, a difference of 0.010%), Haitian (1.3%, a difference of 0.22%), Inupiat (1.3%, a difference of 0.27%), Hispanic or Latino (1.3%, a difference of 0.85%), and Immigrants from Cabo Verde (1.3%, a difference of 1.1%). Similarly, the demographic groups most similar to Natives/Alaskans are Immigrants from Belize (1.3%, a difference of 0.32%), Pima (1.3%, a difference of 0.39%), Immigrants from Cabo Verde (1.3%, a difference of 0.41%), Seminole (1.3%, a difference of 0.52%), and Dutch West Indian (1.3%, a difference of 0.58%).
| Demographics | Rating | Rank | Doctorate Degree |
| Immigrants | Micronesia | 0.1 /100 | #317 | Tragic 1.3% |
| Creek | 0.1 /100 | #318 | Tragic 1.3% |
| Immigrants | Guyana | 0.1 /100 | #319 | Tragic 1.3% |
| Immigrants | St. Vincent and the Grenadines | 0.1 /100 | #320 | Tragic 1.3% |
| Dutch West Indians | 0.1 /100 | #321 | Tragic 1.3% |
| Seminole | 0.1 /100 | #322 | Tragic 1.3% |
| Immigrants | Belize | 0.1 /100 | #323 | Tragic 1.3% |
| Natives/Alaskans | 0.0 /100 | #324 | Tragic 1.3% |
| Pima | 0.0 /100 | #325 | Tragic 1.3% |
| Immigrants | Cabo Verde | 0.0 /100 | #326 | Tragic 1.3% |
| Hispanics or Latinos | 0.0 /100 | #327 | Tragic 1.3% |
| Inupiat | 0.0 /100 | #328 | Tragic 1.3% |
| Haitians | 0.0 /100 | #329 | Tragic 1.3% |
| Yup'ik | 0.0 /100 | #330 | Tragic 1.3% |
| Immigrants | Latin America | 0.0 /100 | #331 | Tragic 1.3% |
| Yakama | 0.0 /100 | #332 | Tragic 1.3% |
| Immigrants | Caribbean | 0.0 /100 | #333 | Tragic 1.3% |
| Immigrants | Dominican Republic | 0.0 /100 | #334 | Tragic 1.3% |
| Immigrants | Haiti | 0.0 /100 | #335 | Tragic 1.3% |
| Nepalese | 0.0 /100 | #336 | Tragic 1.3% |
| Bangladeshis | 0.0 /100 | #337 | Tragic 1.2% |