Argentinean vs Native/Alaskan Doctorate Degree
COMPARE
Argentinean
Native/Alaskan
Doctorate Degree
Doctorate Degree Comparison
Argentineans
Natives/Alaskans
2.3%
DOCTORATE DEGREE
99.9/ 100
METRIC RATING
66th/ 347
METRIC RANK
1.3%
DOCTORATE DEGREE
0.0/ 100
METRIC RATING
324th/ 347
METRIC RANK
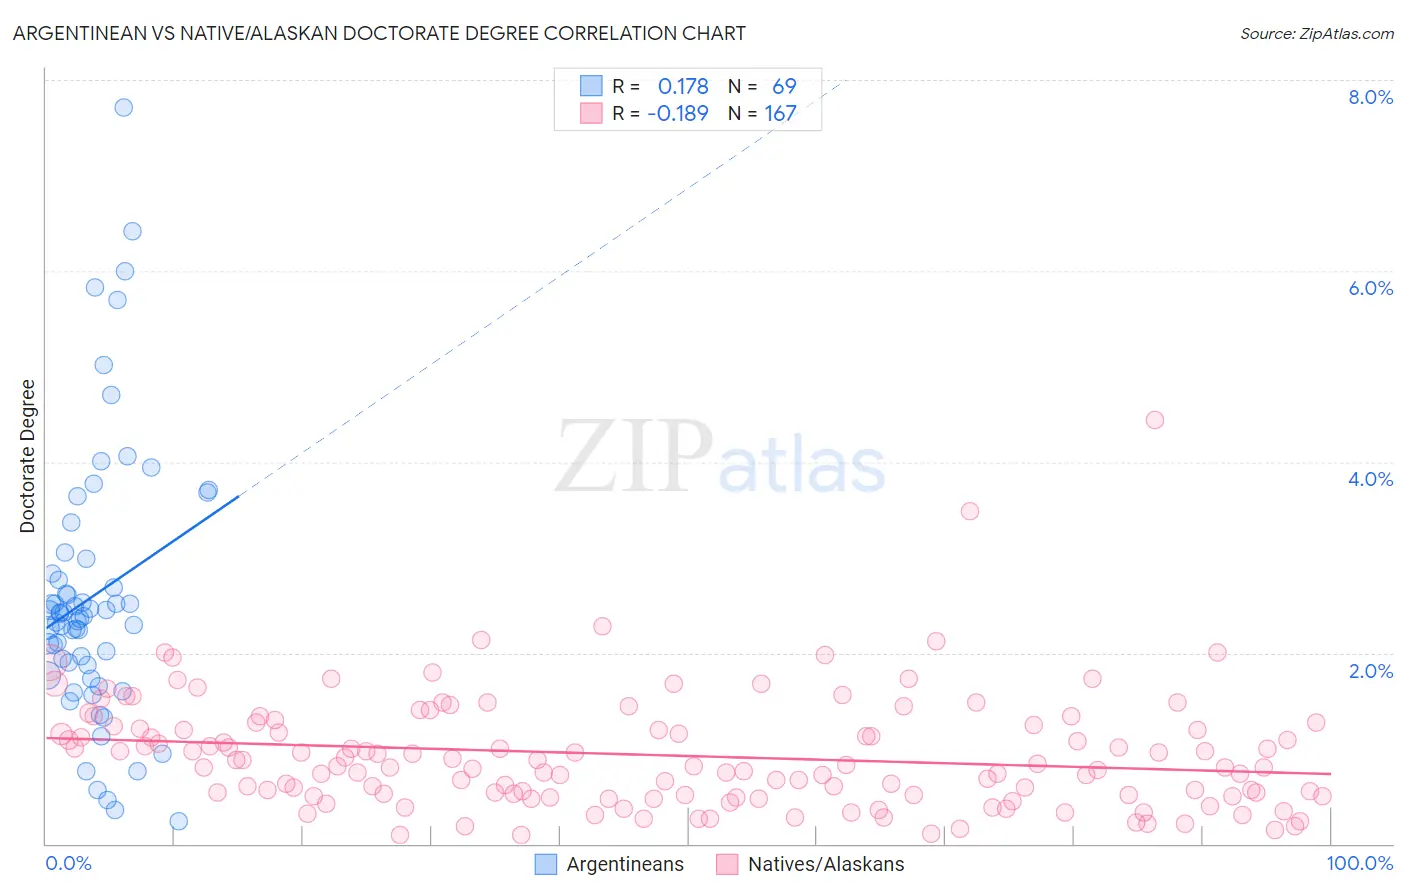
Argentinean vs Native/Alaskan Doctorate Degree Correlation Chart
The statistical analysis conducted on geographies consisting of 296,190,369 people shows a poor positive correlation between the proportion of Argentineans and percentage of population with at least doctorate degree education in the United States with a correlation coefficient (R) of 0.178 and weighted average of 2.3%. Similarly, the statistical analysis conducted on geographies consisting of 497,415,117 people shows a poor negative correlation between the proportion of Natives/Alaskans and percentage of population with at least doctorate degree education in the United States with a correlation coefficient (R) of -0.189 and weighted average of 1.3%, a difference of 72.4%.
Doctorate Degree Correlation Summary
| Measurement | Argentinean | Native/Alaskan |
| Minimum | 0.23% | 0.087% |
| Maximum | 7.7% | 4.4% |
| Range | 7.5% | 4.3% |
| Mean | 2.6% | 0.93% |
| Median | 2.4% | 0.81% |
| Interquartile 25% (IQ1) | 1.8% | 0.51% |
| Interquartile 75% (IQ3) | 2.9% | 1.2% |
| Interquartile Range (IQR) | 1.1% | 0.72% |
| Standard Deviation (Sample) | 1.4% | 0.60% |
| Standard Deviation (Population) | 1.4% | 0.60% |
Similar Demographics by Doctorate Degree
Demographics Similar to Argentineans by Doctorate Degree
In terms of doctorate degree, the demographic groups most similar to Argentineans are Paraguayan (2.3%, a difference of 0.17%), Zimbabwean (2.3%, a difference of 0.46%), Immigrants from Greece (2.3%, a difference of 0.67%), Immigrants from Kazakhstan (2.3%, a difference of 0.69%), and Carpatho Rusyn (2.3%, a difference of 0.94%).
| Demographics | Rating | Rank | Doctorate Degree |
| South Africans | 99.9 /100 | #59 | Exceptional 2.3% |
| Immigrants | Serbia | 99.9 /100 | #60 | Exceptional 2.3% |
| Bhutanese | 99.9 /100 | #61 | Exceptional 2.3% |
| Immigrants | Europe | 99.9 /100 | #62 | Exceptional 2.3% |
| Laotians | 99.9 /100 | #63 | Exceptional 2.3% |
| Immigrants | Greece | 99.9 /100 | #64 | Exceptional 2.3% |
| Paraguayans | 99.9 /100 | #65 | Exceptional 2.3% |
| Argentineans | 99.9 /100 | #66 | Exceptional 2.3% |
| Zimbabweans | 99.8 /100 | #67 | Exceptional 2.3% |
| Immigrants | Kazakhstan | 99.8 /100 | #68 | Exceptional 2.3% |
| Carpatho Rusyns | 99.8 /100 | #69 | Exceptional 2.3% |
| Lithuanians | 99.8 /100 | #70 | Exceptional 2.3% |
| Immigrants | Bolivia | 99.8 /100 | #71 | Exceptional 2.3% |
| Immigrants | Canada | 99.8 /100 | #72 | Exceptional 2.3% |
| Immigrants | Bulgaria | 99.8 /100 | #73 | Exceptional 2.3% |
Demographics Similar to Natives/Alaskans by Doctorate Degree
In terms of doctorate degree, the demographic groups most similar to Natives/Alaskans are Immigrants from Belize (1.3%, a difference of 0.32%), Pima (1.3%, a difference of 0.39%), Immigrants from Cabo Verde (1.3%, a difference of 0.41%), Seminole (1.3%, a difference of 0.52%), and Dutch West Indian (1.3%, a difference of 0.58%).
| Demographics | Rating | Rank | Doctorate Degree |
| Immigrants | Micronesia | 0.1 /100 | #317 | Tragic 1.3% |
| Creek | 0.1 /100 | #318 | Tragic 1.3% |
| Immigrants | Guyana | 0.1 /100 | #319 | Tragic 1.3% |
| Immigrants | St. Vincent and the Grenadines | 0.1 /100 | #320 | Tragic 1.3% |
| Dutch West Indians | 0.1 /100 | #321 | Tragic 1.3% |
| Seminole | 0.1 /100 | #322 | Tragic 1.3% |
| Immigrants | Belize | 0.1 /100 | #323 | Tragic 1.3% |
| Natives/Alaskans | 0.0 /100 | #324 | Tragic 1.3% |
| Pima | 0.0 /100 | #325 | Tragic 1.3% |
| Immigrants | Cabo Verde | 0.0 /100 | #326 | Tragic 1.3% |
| Hispanics or Latinos | 0.0 /100 | #327 | Tragic 1.3% |
| Inupiat | 0.0 /100 | #328 | Tragic 1.3% |
| Haitians | 0.0 /100 | #329 | Tragic 1.3% |
| Yup'ik | 0.0 /100 | #330 | Tragic 1.3% |
| Immigrants | Latin America | 0.0 /100 | #331 | Tragic 1.3% |