Immigrants from Africa vs Spanish American Doctorate Degree
COMPARE
Immigrants from Africa
Spanish American
Doctorate Degree
Doctorate Degree Comparison
Immigrants from Africa
Spanish Americans
2.0%
DOCTORATE DEGREE
87.0/ 100
METRIC RATING
140th/ 347
METRIC RANK
1.7%
DOCTORATE DEGREE
12.9/ 100
METRIC RATING
217th/ 347
METRIC RANK
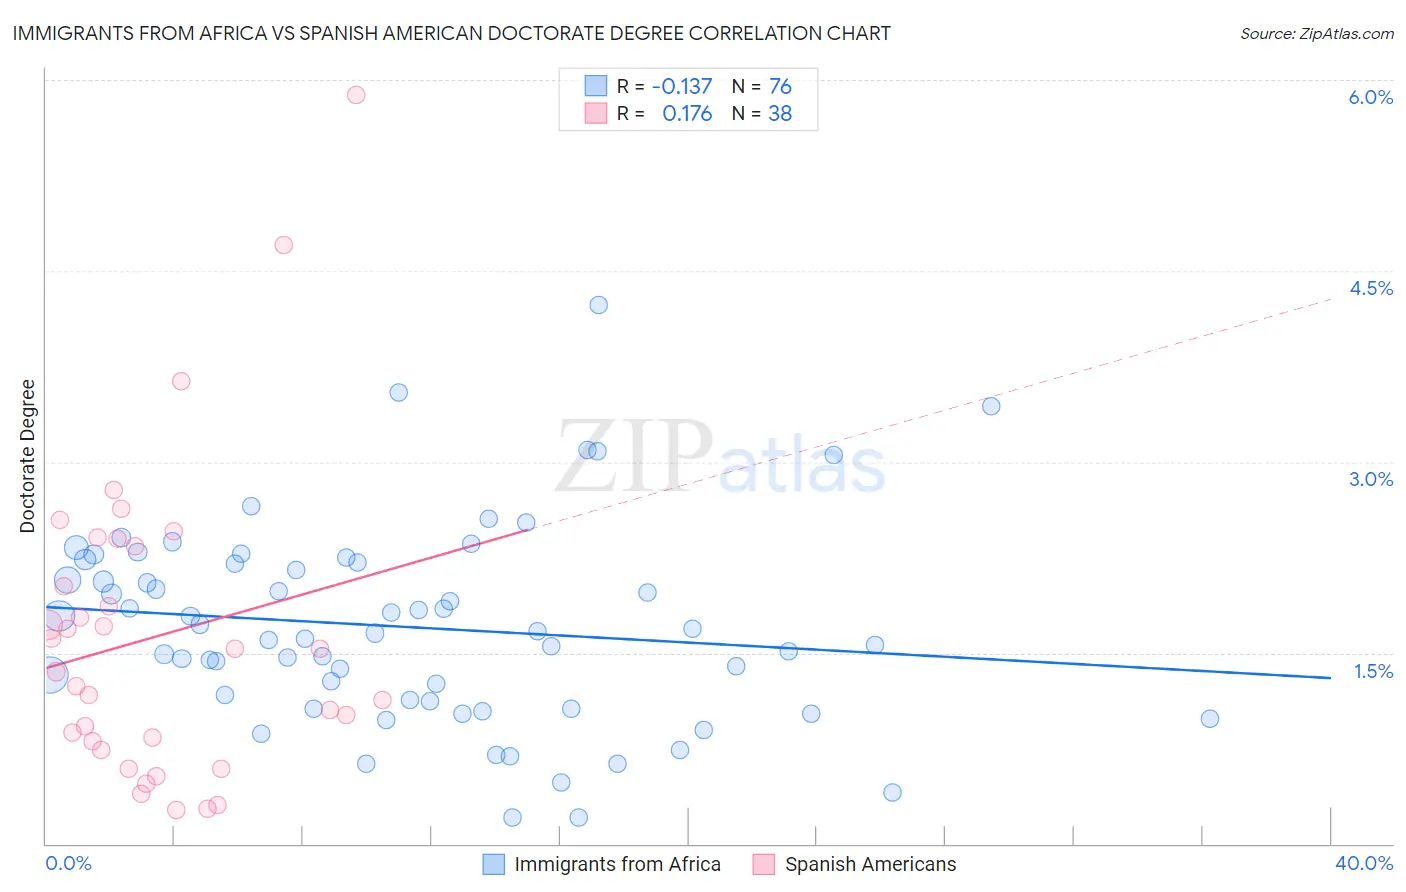
Immigrants from Africa vs Spanish American Doctorate Degree Correlation Chart
The statistical analysis conducted on geographies consisting of 463,247,736 people shows a poor negative correlation between the proportion of Immigrants from Africa and percentage of population with at least doctorate degree education in the United States with a correlation coefficient (R) of -0.137 and weighted average of 2.0%. Similarly, the statistical analysis conducted on geographies consisting of 102,813,703 people shows a poor positive correlation between the proportion of Spanish Americans and percentage of population with at least doctorate degree education in the United States with a correlation coefficient (R) of 0.176 and weighted average of 1.7%, a difference of 15.0%.
Doctorate Degree Correlation Summary
| Measurement | Immigrants from Africa | Spanish American |
| Minimum | 0.20% | 0.26% |
| Maximum | 4.2% | 5.9% |
| Range | 4.0% | 5.6% |
| Mean | 1.7% | 1.6% |
| Median | 1.7% | 1.4% |
| Interquartile 25% (IQ1) | 1.1% | 0.80% |
| Interquartile 75% (IQ3) | 2.2% | 2.3% |
| Interquartile Range (IQR) | 1.1% | 1.5% |
| Standard Deviation (Sample) | 0.78% | 1.2% |
| Standard Deviation (Population) | 0.77% | 1.2% |
Similar Demographics by Doctorate Degree
Demographics Similar to Immigrants from Africa by Doctorate Degree
In terms of doctorate degree, the demographic groups most similar to Immigrants from Africa are Senegalese (2.0%, a difference of 0.070%), Afghan (2.0%, a difference of 0.080%), Italian (2.0%, a difference of 0.28%), Swiss (2.0%, a difference of 0.31%), and South American Indian (2.0%, a difference of 0.40%).
| Demographics | Rating | Rank | Doctorate Degree |
| Immigrants | Uzbekistan | 89.3 /100 | #133 | Excellent 2.0% |
| Immigrants | Cameroon | 88.9 /100 | #134 | Excellent 2.0% |
| Serbians | 88.7 /100 | #135 | Excellent 2.0% |
| Swedes | 88.3 /100 | #136 | Excellent 2.0% |
| South American Indians | 88.3 /100 | #137 | Excellent 2.0% |
| Swiss | 88.0 /100 | #138 | Excellent 2.0% |
| Afghans | 87.2 /100 | #139 | Excellent 2.0% |
| Immigrants | Africa | 87.0 /100 | #140 | Excellent 2.0% |
| Senegalese | 86.7 /100 | #141 | Excellent 2.0% |
| Italians | 86.0 /100 | #142 | Excellent 2.0% |
| Sierra Leoneans | 85.1 /100 | #143 | Excellent 2.0% |
| Immigrants | Moldova | 84.3 /100 | #144 | Excellent 2.0% |
| Kenyans | 83.6 /100 | #145 | Excellent 1.9% |
| Immigrants | Syria | 83.6 /100 | #146 | Excellent 1.9% |
| Immigrants | Senegal | 82.5 /100 | #147 | Excellent 1.9% |
Demographics Similar to Spanish Americans by Doctorate Degree
In terms of doctorate degree, the demographic groups most similar to Spanish Americans are Immigrants from Burma/Myanmar (1.7%, a difference of 0.21%), Alaskan Athabascan (1.7%, a difference of 0.31%), Tlingit-Haida (1.7%, a difference of 0.37%), Korean (1.7%, a difference of 0.45%), and Pueblo (1.7%, a difference of 0.45%).
| Demographics | Rating | Rank | Doctorate Degree |
| Tongans | 15.1 /100 | #210 | Poor 1.7% |
| Immigrants | Armenia | 15.1 /100 | #211 | Poor 1.7% |
| Immigrants | South Eastern Asia | 14.7 /100 | #212 | Poor 1.7% |
| Koreans | 14.2 /100 | #213 | Poor 1.7% |
| Pueblo | 14.2 /100 | #214 | Poor 1.7% |
| Alaskan Athabascans | 13.8 /100 | #215 | Poor 1.7% |
| Immigrants | Burma/Myanmar | 13.5 /100 | #216 | Poor 1.7% |
| Spanish Americans | 12.9 /100 | #217 | Poor 1.7% |
| Tlingit-Haida | 11.9 /100 | #218 | Poor 1.7% |
| Immigrants | Iraq | 10.7 /100 | #219 | Poor 1.7% |
| Immigrants | Uruguay | 9.2 /100 | #220 | Tragic 1.7% |
| Immigrants | Nonimmigrants | 8.8 /100 | #221 | Tragic 1.7% |
| Immigrants | Venezuela | 8.7 /100 | #222 | Tragic 1.7% |
| Immigrants | Bosnia and Herzegovina | 7.8 /100 | #223 | Tragic 1.7% |
| Immigrants | Poland | 7.4 /100 | #224 | Tragic 1.7% |