Immigrants from Africa vs Bhutanese Doctorate Degree
COMPARE
Immigrants from Africa
Bhutanese
Doctorate Degree
Doctorate Degree Comparison
Immigrants from Africa
Bhutanese
2.0%
DOCTORATE DEGREE
87.0/ 100
METRIC RATING
140th/ 347
METRIC RANK
2.3%
DOCTORATE DEGREE
99.9/ 100
METRIC RATING
61st/ 347
METRIC RANK
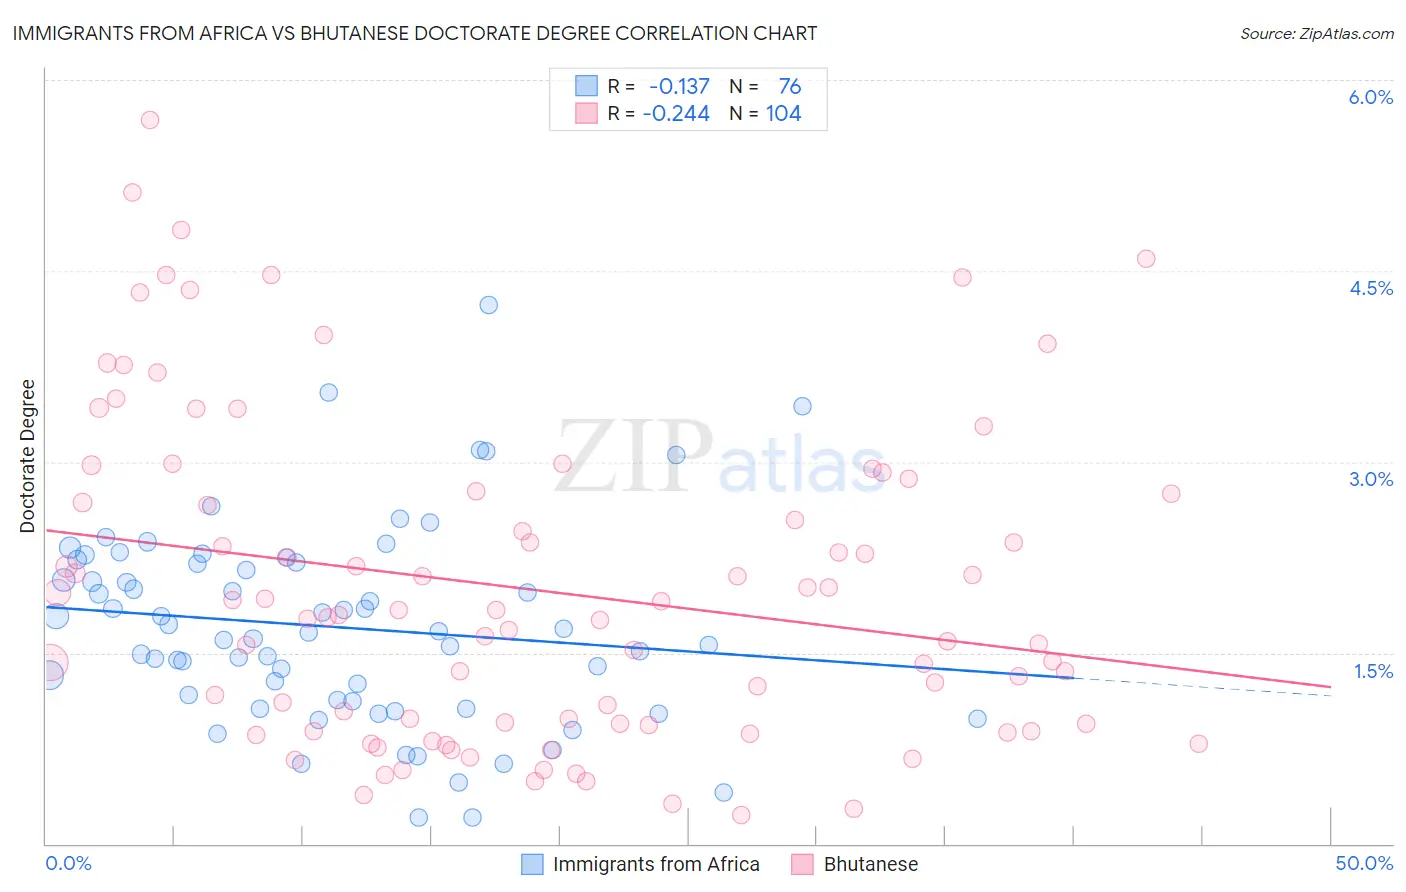
Immigrants from Africa vs Bhutanese Doctorate Degree Correlation Chart
The statistical analysis conducted on geographies consisting of 463,247,736 people shows a poor negative correlation between the proportion of Immigrants from Africa and percentage of population with at least doctorate degree education in the United States with a correlation coefficient (R) of -0.137 and weighted average of 2.0%. Similarly, the statistical analysis conducted on geographies consisting of 449,637,432 people shows a weak negative correlation between the proportion of Bhutanese and percentage of population with at least doctorate degree education in the United States with a correlation coefficient (R) of -0.244 and weighted average of 2.3%, a difference of 18.0%.
Doctorate Degree Correlation Summary
| Measurement | Immigrants from Africa | Bhutanese |
| Minimum | 0.20% | 0.23% |
| Maximum | 4.2% | 5.7% |
| Range | 4.0% | 5.5% |
| Mean | 1.7% | 2.0% |
| Median | 1.7% | 1.8% |
| Interquartile 25% (IQ1) | 1.1% | 0.94% |
| Interquartile 75% (IQ3) | 2.2% | 2.8% |
| Interquartile Range (IQR) | 1.1% | 1.8% |
| Standard Deviation (Sample) | 0.78% | 1.3% |
| Standard Deviation (Population) | 0.77% | 1.3% |
Similar Demographics by Doctorate Degree
Demographics Similar to Immigrants from Africa by Doctorate Degree
In terms of doctorate degree, the demographic groups most similar to Immigrants from Africa are Senegalese (2.0%, a difference of 0.070%), Afghan (2.0%, a difference of 0.080%), Italian (2.0%, a difference of 0.28%), Swiss (2.0%, a difference of 0.31%), and South American Indian (2.0%, a difference of 0.40%).
| Demographics | Rating | Rank | Doctorate Degree |
| Immigrants | Uzbekistan | 89.3 /100 | #133 | Excellent 2.0% |
| Immigrants | Cameroon | 88.9 /100 | #134 | Excellent 2.0% |
| Serbians | 88.7 /100 | #135 | Excellent 2.0% |
| Swedes | 88.3 /100 | #136 | Excellent 2.0% |
| South American Indians | 88.3 /100 | #137 | Excellent 2.0% |
| Swiss | 88.0 /100 | #138 | Excellent 2.0% |
| Afghans | 87.2 /100 | #139 | Excellent 2.0% |
| Immigrants | Africa | 87.0 /100 | #140 | Excellent 2.0% |
| Senegalese | 86.7 /100 | #141 | Excellent 2.0% |
| Italians | 86.0 /100 | #142 | Excellent 2.0% |
| Sierra Leoneans | 85.1 /100 | #143 | Excellent 2.0% |
| Immigrants | Moldova | 84.3 /100 | #144 | Excellent 2.0% |
| Kenyans | 83.6 /100 | #145 | Excellent 1.9% |
| Immigrants | Syria | 83.6 /100 | #146 | Excellent 1.9% |
| Immigrants | Senegal | 82.5 /100 | #147 | Excellent 1.9% |
Demographics Similar to Bhutanese by Doctorate Degree
In terms of doctorate degree, the demographic groups most similar to Bhutanese are Immigrants from Europe (2.3%, a difference of 0.52%), Laotian (2.3%, a difference of 0.62%), Immigrants from Serbia (2.3%, a difference of 0.77%), South African (2.3%, a difference of 0.79%), and Immigrants from Greece (2.3%, a difference of 1.0%).
| Demographics | Rating | Rank | Doctorate Degree |
| Immigrants | Indonesia | 100.0 /100 | #54 | Exceptional 2.4% |
| Bolivians | 100.0 /100 | #55 | Exceptional 2.4% |
| Immigrants | Czechoslovakia | 100.0 /100 | #56 | Exceptional 2.4% |
| Immigrants | Ethiopia | 100.0 /100 | #57 | Exceptional 2.4% |
| Ethiopians | 99.9 /100 | #58 | Exceptional 2.3% |
| South Africans | 99.9 /100 | #59 | Exceptional 2.3% |
| Immigrants | Serbia | 99.9 /100 | #60 | Exceptional 2.3% |
| Bhutanese | 99.9 /100 | #61 | Exceptional 2.3% |
| Immigrants | Europe | 99.9 /100 | #62 | Exceptional 2.3% |
| Laotians | 99.9 /100 | #63 | Exceptional 2.3% |
| Immigrants | Greece | 99.9 /100 | #64 | Exceptional 2.3% |
| Paraguayans | 99.9 /100 | #65 | Exceptional 2.3% |
| Argentineans | 99.9 /100 | #66 | Exceptional 2.3% |
| Zimbabweans | 99.8 /100 | #67 | Exceptional 2.3% |
| Immigrants | Kazakhstan | 99.8 /100 | #68 | Exceptional 2.3% |