Immigrants from Afghanistan vs Immigrants from Canada Doctorate Degree
COMPARE
Immigrants from Afghanistan
Immigrants from Canada
Doctorate Degree
Doctorate Degree Comparison
Immigrants from Afghanistan
Immigrants from Canada
1.8%
DOCTORATE DEGREE
44.3/ 100
METRIC RATING
182nd/ 347
METRIC RANK
2.3%
DOCTORATE DEGREE
99.8/ 100
METRIC RATING
72nd/ 347
METRIC RANK
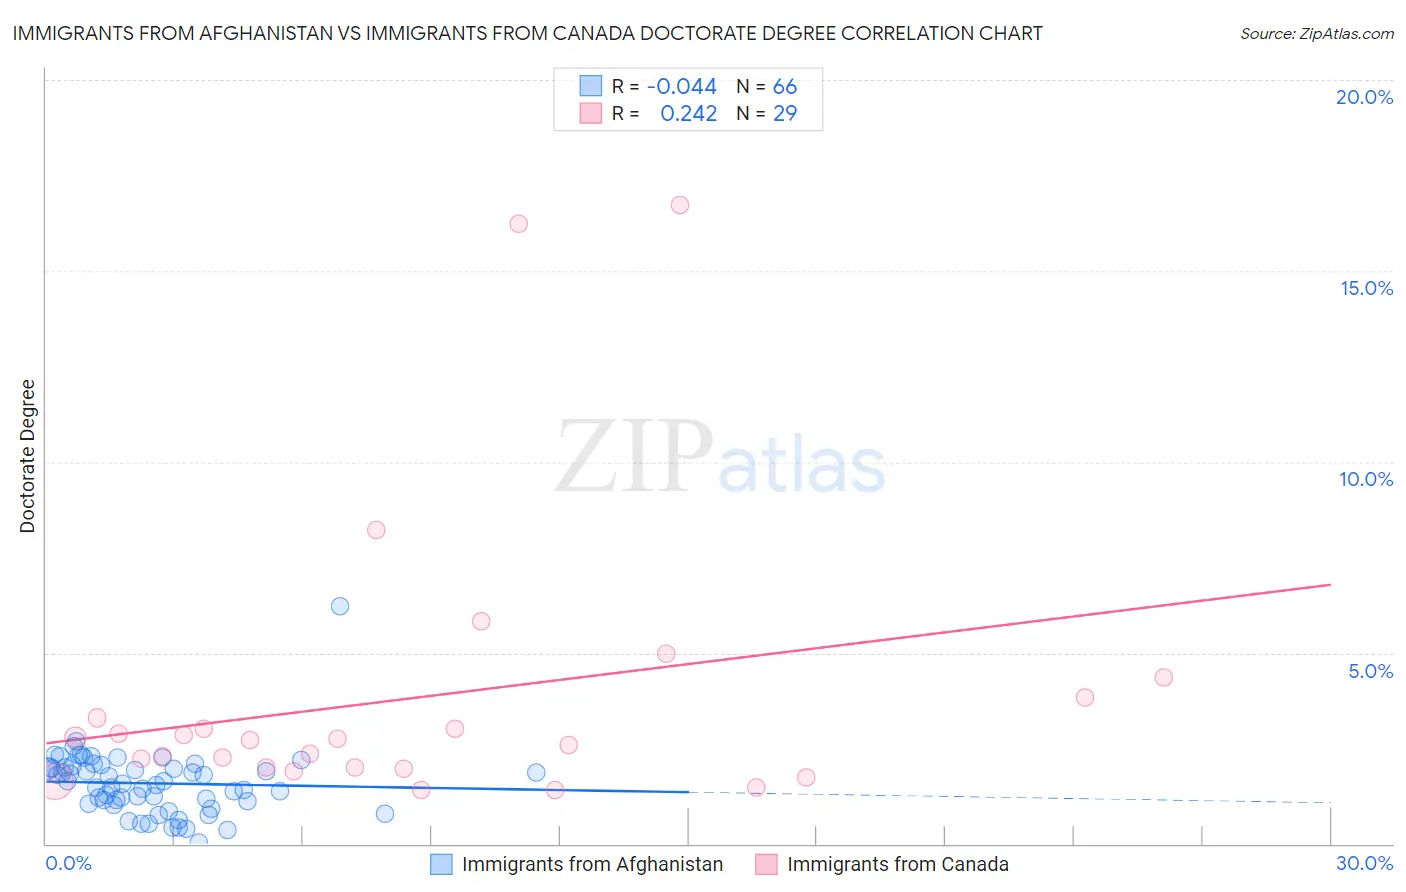
Immigrants from Afghanistan vs Immigrants from Canada Doctorate Degree Correlation Chart
The statistical analysis conducted on geographies consisting of 147,399,207 people shows no correlation between the proportion of Immigrants from Afghanistan and percentage of population with at least doctorate degree education in the United States with a correlation coefficient (R) of -0.044 and weighted average of 1.8%. Similarly, the statistical analysis conducted on geographies consisting of 452,998,134 people shows a weak positive correlation between the proportion of Immigrants from Canada and percentage of population with at least doctorate degree education in the United States with a correlation coefficient (R) of 0.242 and weighted average of 2.3%, a difference of 23.7%.
Doctorate Degree Correlation Summary
| Measurement | Immigrants from Afghanistan | Immigrants from Canada |
| Minimum | 0.038% | 1.4% |
| Maximum | 6.2% | 16.7% |
| Range | 6.2% | 15.3% |
| Mean | 1.6% | 3.8% |
| Median | 1.6% | 2.7% |
| Interquartile 25% (IQ1) | 1.1% | 2.0% |
| Interquartile 75% (IQ3) | 2.0% | 3.6% |
| Interquartile Range (IQR) | 0.88% | 1.6% |
| Standard Deviation (Sample) | 0.86% | 3.8% |
| Standard Deviation (Population) | 0.85% | 3.7% |
Similar Demographics by Doctorate Degree
Demographics Similar to Immigrants from Afghanistan by Doctorate Degree
In terms of doctorate degree, the demographic groups most similar to Immigrants from Afghanistan are Immigrants (1.8%, a difference of 0.29%), Finnish (1.8%, a difference of 0.34%), Scandinavian (1.8%, a difference of 0.55%), Ghanaian (1.8%, a difference of 0.60%), and Nigerian (1.8%, a difference of 0.66%).
| Demographics | Rating | Rank | Doctorate Degree |
| Immigrants | Thailand | 49.4 /100 | #175 | Average 1.8% |
| Spanish | 49.3 /100 | #176 | Average 1.8% |
| Iraqis | 49.2 /100 | #177 | Average 1.8% |
| French | 48.8 /100 | #178 | Average 1.8% |
| Ghanaians | 48.3 /100 | #179 | Average 1.8% |
| Scandinavians | 48.0 /100 | #180 | Average 1.8% |
| Immigrants | Immigrants | 46.2 /100 | #181 | Average 1.8% |
| Immigrants | Afghanistan | 44.3 /100 | #182 | Average 1.8% |
| Finns | 42.1 /100 | #183 | Average 1.8% |
| Nigerians | 39.9 /100 | #184 | Fair 1.8% |
| Slovaks | 36.4 /100 | #185 | Fair 1.8% |
| Peruvians | 34.4 /100 | #186 | Fair 1.8% |
| Czechoslovakians | 33.0 /100 | #187 | Fair 1.8% |
| Germans | 30.5 /100 | #188 | Fair 1.8% |
| French Canadians | 30.2 /100 | #189 | Fair 1.8% |
Demographics Similar to Immigrants from Canada by Doctorate Degree
In terms of doctorate degree, the demographic groups most similar to Immigrants from Canada are Immigrants from Bulgaria (2.3%, a difference of 0.080%), Lithuanian (2.3%, a difference of 0.16%), Immigrants from Bolivia (2.3%, a difference of 0.16%), Immigrants from North America (2.2%, a difference of 0.22%), and Carpatho Rusyn (2.3%, a difference of 0.30%).
| Demographics | Rating | Rank | Doctorate Degree |
| Paraguayans | 99.9 /100 | #65 | Exceptional 2.3% |
| Argentineans | 99.9 /100 | #66 | Exceptional 2.3% |
| Zimbabweans | 99.8 /100 | #67 | Exceptional 2.3% |
| Immigrants | Kazakhstan | 99.8 /100 | #68 | Exceptional 2.3% |
| Carpatho Rusyns | 99.8 /100 | #69 | Exceptional 2.3% |
| Lithuanians | 99.8 /100 | #70 | Exceptional 2.3% |
| Immigrants | Bolivia | 99.8 /100 | #71 | Exceptional 2.3% |
| Immigrants | Canada | 99.8 /100 | #72 | Exceptional 2.3% |
| Immigrants | Bulgaria | 99.8 /100 | #73 | Exceptional 2.3% |
| Immigrants | North America | 99.8 /100 | #74 | Exceptional 2.2% |
| Immigrants | Western Asia | 99.8 /100 | #75 | Exceptional 2.2% |
| Immigrants | Hungary | 99.8 /100 | #76 | Exceptional 2.2% |
| Immigrants | Lebanon | 99.8 /100 | #77 | Exceptional 2.2% |
| Immigrants | Belarus | 99.7 /100 | #78 | Exceptional 2.2% |
| Northern Europeans | 99.7 /100 | #79 | Exceptional 2.2% |