Argentinean vs Irish Doctorate Degree
COMPARE
Argentinean
Irish
Doctorate Degree
Doctorate Degree Comparison
Argentineans
Irish
2.3%
DOCTORATE DEGREE
99.9/ 100
METRIC RATING
66th/ 347
METRIC RANK
1.9%
DOCTORATE DEGREE
67.5/ 100
METRIC RATING
162nd/ 347
METRIC RANK
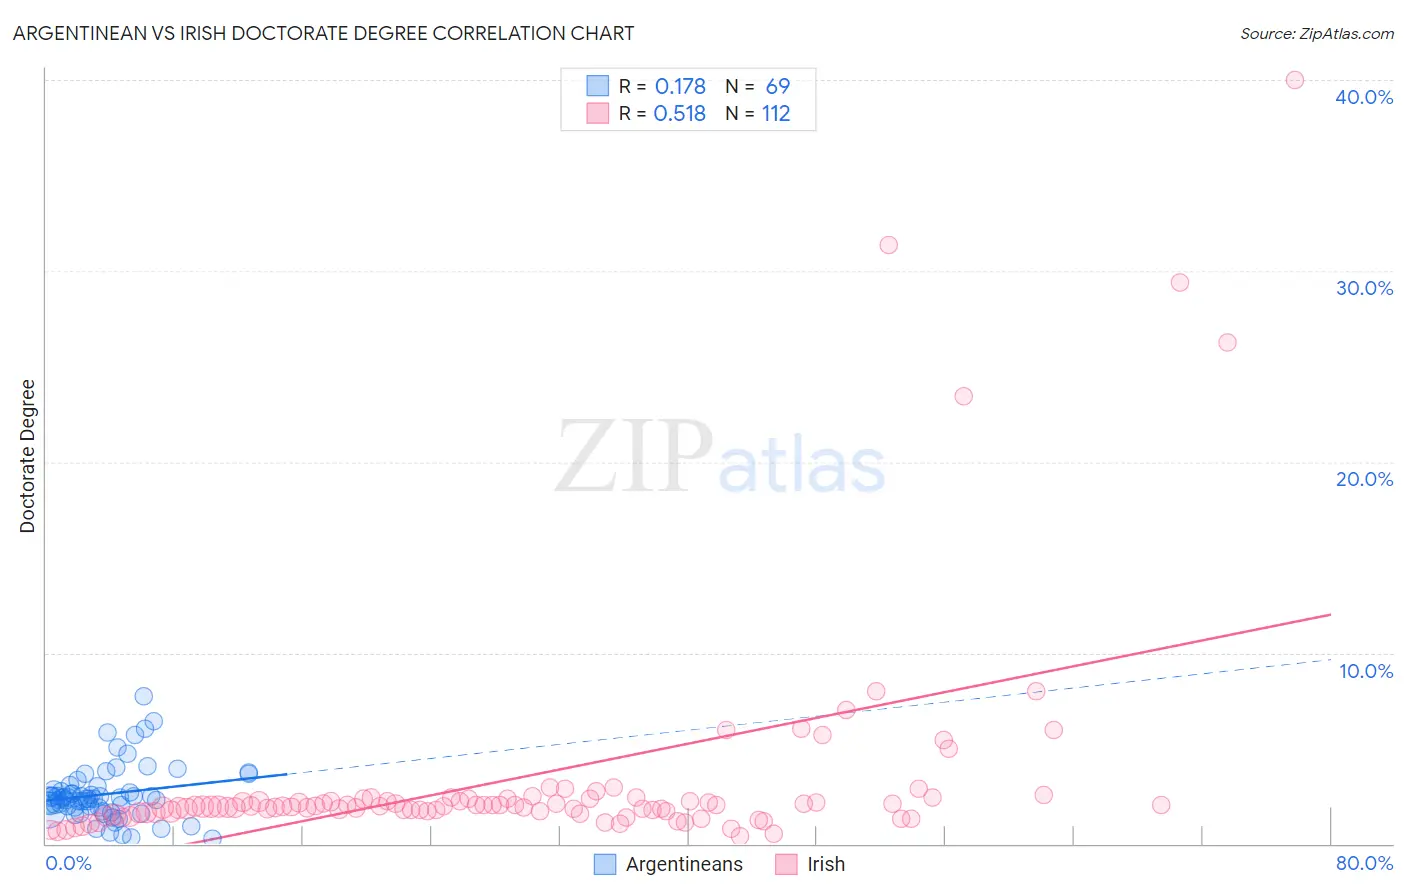
Argentinean vs Irish Doctorate Degree Correlation Chart
The statistical analysis conducted on geographies consisting of 296,190,369 people shows a poor positive correlation between the proportion of Argentineans and percentage of population with at least doctorate degree education in the United States with a correlation coefficient (R) of 0.178 and weighted average of 2.3%. Similarly, the statistical analysis conducted on geographies consisting of 550,861,641 people shows a substantial positive correlation between the proportion of Irish and percentage of population with at least doctorate degree education in the United States with a correlation coefficient (R) of 0.518 and weighted average of 1.9%, a difference of 20.9%.
Doctorate Degree Correlation Summary
| Measurement | Argentinean | Irish |
| Minimum | 0.23% | 0.38% |
| Maximum | 7.7% | 40.0% |
| Range | 7.5% | 39.6% |
| Mean | 2.6% | 3.4% |
| Median | 2.4% | 2.0% |
| Interquartile 25% (IQ1) | 1.8% | 1.7% |
| Interquartile 75% (IQ3) | 2.9% | 2.3% |
| Interquartile Range (IQR) | 1.1% | 0.66% |
| Standard Deviation (Sample) | 1.4% | 6.1% |
| Standard Deviation (Population) | 1.4% | 6.0% |
Similar Demographics by Doctorate Degree
Demographics Similar to Argentineans by Doctorate Degree
In terms of doctorate degree, the demographic groups most similar to Argentineans are Paraguayan (2.3%, a difference of 0.17%), Zimbabwean (2.3%, a difference of 0.46%), Immigrants from Greece (2.3%, a difference of 0.67%), Immigrants from Kazakhstan (2.3%, a difference of 0.69%), and Carpatho Rusyn (2.3%, a difference of 0.94%).
| Demographics | Rating | Rank | Doctorate Degree |
| South Africans | 99.9 /100 | #59 | Exceptional 2.3% |
| Immigrants | Serbia | 99.9 /100 | #60 | Exceptional 2.3% |
| Bhutanese | 99.9 /100 | #61 | Exceptional 2.3% |
| Immigrants | Europe | 99.9 /100 | #62 | Exceptional 2.3% |
| Laotians | 99.9 /100 | #63 | Exceptional 2.3% |
| Immigrants | Greece | 99.9 /100 | #64 | Exceptional 2.3% |
| Paraguayans | 99.9 /100 | #65 | Exceptional 2.3% |
| Argentineans | 99.9 /100 | #66 | Exceptional 2.3% |
| Zimbabweans | 99.8 /100 | #67 | Exceptional 2.3% |
| Immigrants | Kazakhstan | 99.8 /100 | #68 | Exceptional 2.3% |
| Carpatho Rusyns | 99.8 /100 | #69 | Exceptional 2.3% |
| Lithuanians | 99.8 /100 | #70 | Exceptional 2.3% |
| Immigrants | Bolivia | 99.8 /100 | #71 | Exceptional 2.3% |
| Immigrants | Canada | 99.8 /100 | #72 | Exceptional 2.3% |
| Immigrants | Bulgaria | 99.8 /100 | #73 | Exceptional 2.3% |
Demographics Similar to Irish by Doctorate Degree
In terms of doctorate degree, the demographic groups most similar to Irish are Czech (1.9%, a difference of 0.040%), Celtic (1.9%, a difference of 0.13%), Immigrants from Middle Africa (1.9%, a difference of 0.21%), Welsh (1.9%, a difference of 0.36%), and Slovene (1.9%, a difference of 0.45%).
| Demographics | Rating | Rank | Doctorate Degree |
| Poles | 72.7 /100 | #155 | Good 1.9% |
| Slavs | 72.4 /100 | #156 | Good 1.9% |
| Danes | 71.9 /100 | #157 | Good 1.9% |
| Hungarians | 71.7 /100 | #158 | Good 1.9% |
| Slovenes | 70.2 /100 | #159 | Good 1.9% |
| Welsh | 69.7 /100 | #160 | Good 1.9% |
| Immigrants | Middle Africa | 68.8 /100 | #161 | Good 1.9% |
| Irish | 67.5 /100 | #162 | Good 1.9% |
| Czechs | 67.3 /100 | #163 | Good 1.9% |
| Celtics | 66.7 /100 | #164 | Good 1.9% |
| Scotch-Irish | 63.6 /100 | #165 | Good 1.9% |
| Spaniards | 63.5 /100 | #166 | Good 1.9% |
| Macedonians | 60.9 /100 | #167 | Good 1.9% |
| Sri Lankans | 60.3 /100 | #168 | Good 1.9% |
| Vietnamese | 54.8 /100 | #169 | Average 1.9% |