Immigrants from Afghanistan vs Immigrants Doctorate Degree
COMPARE
Immigrants from Afghanistan
Immigrants
Doctorate Degree
Doctorate Degree Comparison
Immigrants from Afghanistan
Immigrants
1.8%
DOCTORATE DEGREE
44.3/ 100
METRIC RATING
182nd/ 347
METRIC RANK
1.8%
DOCTORATE DEGREE
46.2/ 100
METRIC RATING
181st/ 347
METRIC RANK
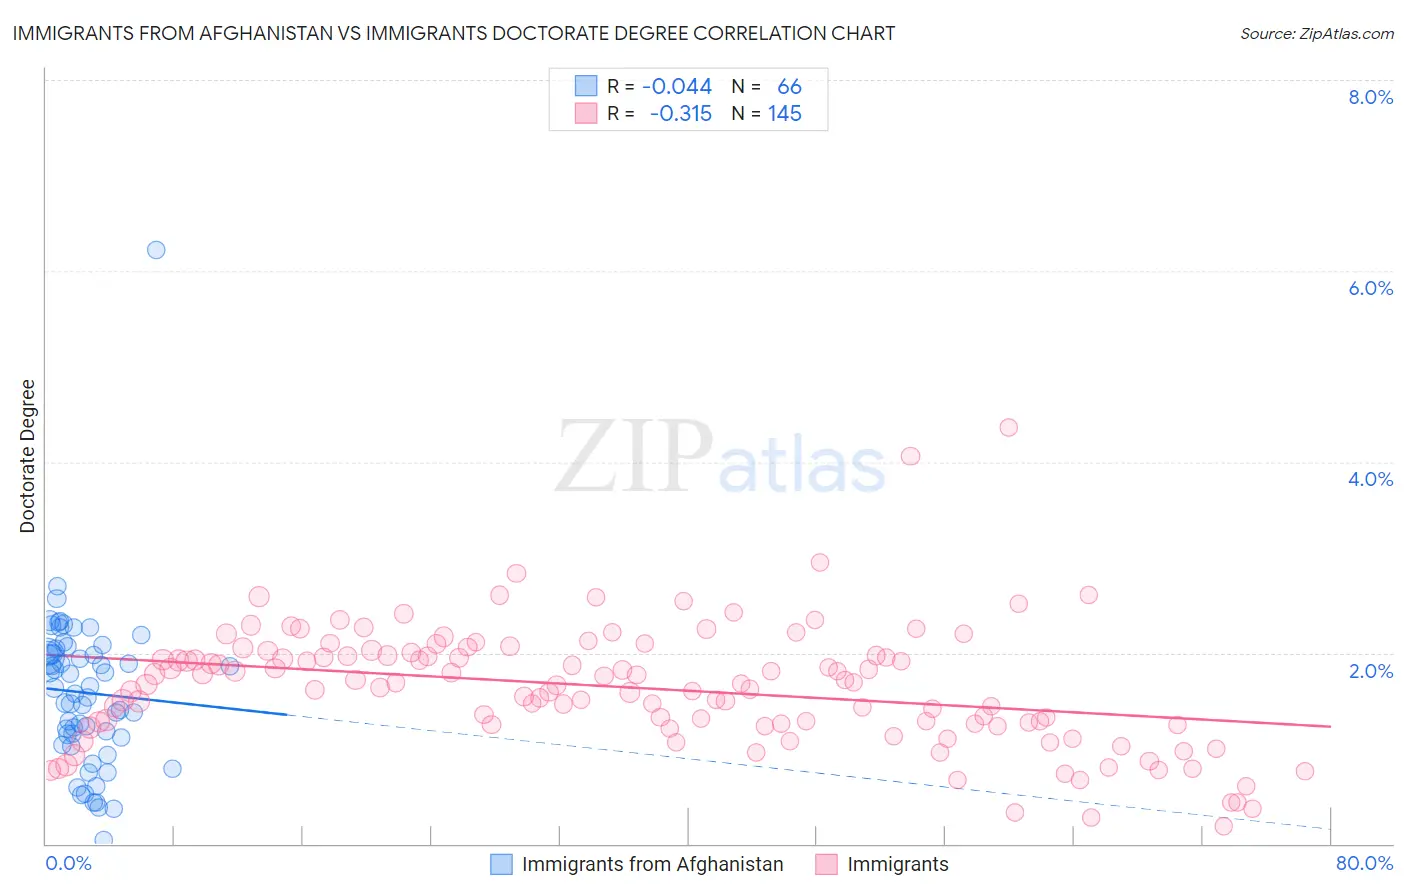
Immigrants from Afghanistan vs Immigrants Doctorate Degree Correlation Chart
The statistical analysis conducted on geographies consisting of 147,399,207 people shows no correlation between the proportion of Immigrants from Afghanistan and percentage of population with at least doctorate degree education in the United States with a correlation coefficient (R) of -0.044 and weighted average of 1.8%. Similarly, the statistical analysis conducted on geographies consisting of 551,358,177 people shows a mild negative correlation between the proportion of Immigrants and percentage of population with at least doctorate degree education in the United States with a correlation coefficient (R) of -0.315 and weighted average of 1.8%, a difference of 0.29%.
Doctorate Degree Correlation Summary
| Measurement | Immigrants from Afghanistan | Immigrants |
| Minimum | 0.038% | 0.18% |
| Maximum | 6.2% | 4.4% |
| Range | 6.2% | 4.2% |
| Mean | 1.6% | 1.6% |
| Median | 1.6% | 1.7% |
| Interquartile 25% (IQ1) | 1.1% | 1.2% |
| Interquartile 75% (IQ3) | 2.0% | 2.0% |
| Interquartile Range (IQR) | 0.88% | 0.74% |
| Standard Deviation (Sample) | 0.86% | 0.64% |
| Standard Deviation (Population) | 0.85% | 0.64% |
Demographics Similar to Immigrants from Afghanistan and Immigrants by Doctorate Degree
In terms of doctorate degree, the demographic groups most similar to Immigrants from Afghanistan are Finnish (1.8%, a difference of 0.34%), Scandinavian (1.8%, a difference of 0.55%), Ghanaian (1.8%, a difference of 0.60%), Nigerian (1.8%, a difference of 0.66%), and French (1.8%, a difference of 0.67%). Similarly, the demographic groups most similar to Immigrants are Scandinavian (1.8%, a difference of 0.26%), Ghanaian (1.8%, a difference of 0.31%), French (1.8%, a difference of 0.38%), Iraqi (1.8%, a difference of 0.44%), and Spanish (1.8%, a difference of 0.46%).
| Demographics | Rating | Rank | Doctorate Degree |
| Bermudans | 52.1 /100 | #171 | Average 1.8% |
| Belgians | 50.3 /100 | #172 | Average 1.8% |
| Norwegians | 50.0 /100 | #173 | Average 1.8% |
| Immigrants | Bangladesh | 50.0 /100 | #174 | Average 1.8% |
| Immigrants | Thailand | 49.4 /100 | #175 | Average 1.8% |
| Spanish | 49.3 /100 | #176 | Average 1.8% |
| Iraqis | 49.2 /100 | #177 | Average 1.8% |
| French | 48.8 /100 | #178 | Average 1.8% |
| Ghanaians | 48.3 /100 | #179 | Average 1.8% |
| Scandinavians | 48.0 /100 | #180 | Average 1.8% |
| Immigrants | Immigrants | 46.2 /100 | #181 | Average 1.8% |
| Immigrants | Afghanistan | 44.3 /100 | #182 | Average 1.8% |
| Finns | 42.1 /100 | #183 | Average 1.8% |
| Nigerians | 39.9 /100 | #184 | Fair 1.8% |
| Slovaks | 36.4 /100 | #185 | Fair 1.8% |
| Peruvians | 34.4 /100 | #186 | Fair 1.8% |
| Czechoslovakians | 33.0 /100 | #187 | Fair 1.8% |
| Germans | 30.5 /100 | #188 | Fair 1.8% |
| French Canadians | 30.2 /100 | #189 | Fair 1.8% |
| Immigrants | Costa Rica | 30.2 /100 | #190 | Fair 1.8% |
| South Americans | 29.5 /100 | #191 | Fair 1.8% |