Immigrants from Dominica vs Immigrants from Canada Doctorate Degree

COMPARE

Immigrants from Dominica
Race
Ancestry
AfghanAfricanAlaska NativeAlaskan AthabascanAlbanianAleutAlsatianAmericanApacheArabArapahoArgentineanArmenianAssyrian/Chaldean/SyriacAustralianAustrianBahamianBangladeshiBarbadianBasqueBelgianBelizeanBermudanBhutaneseBlackfeetBolivianBrazilianBritishBritish West IndianBulgarianBurmeseCajunCambodianCanadianCape VerdeanCarpatho RusynCelticCentral AmericanCentral American IndianCherokeeCheyenneChickasawChileanChineseChippewaChoctawColombianColvilleComancheCosta RicanCreeCreekCroatianCrowCubanCypriotCzechCzechoslovakianDanishDelawareDominicanDutchDutch West IndianEastern EuropeanEcuadorianEgyptianEnglishEstonianEthiopianEuropeanFijianFilipinoFinnishFrenchFrench American IndianFrench CanadianGermanGerman RussianGhanaianGreekGuamanian/ChamorroGuatemalanGuyaneseHaitianHmongHonduranHopiHoumaHungarianIcelanderIndian (Asian)IndonesianInupiatIranianIraqiIrishIroquoisIsraeliItalianJamaicanJapaneseJordanianKenyanKiowaKoreanLaotianLatvianLebaneseLiberianLithuanianLumbeeLuxembourgerMacedonianMalaysianMalteseMarshalleseMenomineeMexicanMexican American IndianMongolianMoroccanNative HawaiianNavajoNepaleseNew ZealanderNicaraguanNigerianNorthern EuropeanNorwegianOkinawanOsageOttawaPaiutePakistaniPalestinianPanamanianParaguayanPennsylvania GermanPeruvianPimaPolishPortuguesePotawatomiPuebloPuerto RicanPuget Sound SalishRomanianRussianSalvadoranSamoanScandinavianScotch-IrishScottishSeminoleSenegaleseSerbianShoshoneSierra LeoneanSiouxSlavicSlovakSloveneSomaliSouth AfricanSouth AmericanSouth American IndianSoviet UnionSpaniardSpanishSpanish AmericanSpanish American IndianSri LankanSubsaharan AfricanSudaneseSwedishSwissSyrianTaiwaneseThaiTlingit-HaidaTohono O'OdhamTonganTrinidadian and TobagonianTsimshianTurkishU.S. Virgin IslanderUgandanUkrainianUruguayanUteVenezuelanVietnameseWelshWest IndianYakamaYaquiYugoslavianYumanYup'ikZimbabwean
Immigration
NonimmigrantsImmigrantsAfghanistanAfricaAlbaniaArgentinaArmeniaAsiaAustraliaAustriaBahamasBangladeshBarbadosBelarusBelgiumBelizeBoliviaBosnia and HerzegovinaBrazilBulgariaBurma/MyanmarCabo VerdeCambodiaCameroonCaribbeanCentral AmericaChileChinaColombiaCongoCosta RicaCroatiaCubaCzechoslovakiaDenmarkDominicaDominican RepublicEastern AfricaEastern AsiaEastern EuropeEcuadorEgyptEl SalvadorEnglandEritreaEthiopiaEuropeFijiFranceGermanyGhanaGreeceGrenadaGuatemalaGuyanaHaitiHondurasHong KongHungaryIndiaIndonesiaIranIraqIrelandIsraelItalyJamaicaJapanJordanKazakhstanKenyaKoreaKuwaitLaosLatin AmericaLatviaLebanonLiberiaLithuaniaMalaysiaMexicoMicronesiaMiddle AfricaMoldovaMoroccoNepalNetherlandsNicaraguaNigeriaNorth AmericaNorth MacedoniaNorthern AfricaNorthern EuropeNorwayOceaniaPakistanPanamaPeruPhilippinesPolandPortugalRomaniaRussiaSaudi ArabiaScotlandSenegalSerbiaSierra LeoneSingaporeSomaliaSouth AfricaSouth AmericaSouth Central AsiaSouth Eastern AsiaSouthern EuropeSpainSri LankaSt. Vincent and the GrenadinesSudanSwedenSwitzerlandSyriaTaiwanThailandTrinidad and TobagoTurkeyUgandaUkraineUruguayUzbekistanVenezuelaVietnamWest IndiesWestern AfricaWestern AsiaWestern EuropeYemenZaireZimbabweAzores
Immigrants from Canada
Race
Ancestry
AfghanAfricanAlaska NativeAlaskan AthabascanAlbanianAleutAlsatianAmericanApacheArabArapahoArgentineanArmenianAssyrian/Chaldean/SyriacAustralianAustrianBahamianBangladeshiBarbadianBasqueBelgianBelizeanBermudanBhutaneseBlackfeetBolivianBrazilianBritishBritish West IndianBulgarianBurmeseCajunCambodianCanadianCape VerdeanCarpatho RusynCelticCentral AmericanCentral American IndianCherokeeCheyenneChickasawChileanChineseChippewaChoctawColombianColvilleComancheCosta RicanCreeCreekCroatianCrowCubanCypriotCzechCzechoslovakianDanishDelawareDominicanDutchDutch West IndianEastern EuropeanEcuadorianEgyptianEnglishEstonianEthiopianEuropeanFijianFilipinoFinnishFrenchFrench American IndianFrench CanadianGermanGerman RussianGhanaianGreekGuamanian/ChamorroGuatemalanGuyaneseHaitianHmongHonduranHopiHoumaHungarianIcelanderIndian (Asian)IndonesianInupiatIranianIraqiIrishIroquoisIsraeliItalianJamaicanJapaneseJordanianKenyanKiowaKoreanLaotianLatvianLebaneseLiberianLithuanianLumbeeLuxembourgerMacedonianMalaysianMalteseMarshalleseMenomineeMexicanMexican American IndianMongolianMoroccanNative HawaiianNavajoNepaleseNew ZealanderNicaraguanNigerianNorthern EuropeanNorwegianOkinawanOsageOttawaPaiutePakistaniPalestinianPanamanianParaguayanPennsylvania GermanPeruvianPimaPolishPortuguesePotawatomiPuebloPuerto RicanPuget Sound SalishRomanianRussianSalvadoranSamoanScandinavianScotch-IrishScottishSeminoleSenegaleseSerbianShoshoneSierra LeoneanSiouxSlavicSlovakSloveneSomaliSouth AfricanSouth AmericanSouth American IndianSoviet UnionSpaniardSpanishSpanish AmericanSpanish American IndianSri LankanSubsaharan AfricanSudaneseSwedishSwissSyrianTaiwaneseThaiTlingit-HaidaTohono O'OdhamTonganTrinidadian and TobagonianTsimshianTurkishU.S. Virgin IslanderUgandanUkrainianUruguayanUteVenezuelanVietnameseWelshWest IndianYakamaYaquiYugoslavianYumanYup'ikZimbabwean
Immigration
NonimmigrantsImmigrantsAfghanistanAfricaAlbaniaArgentinaArmeniaAsiaAustraliaAustriaBahamasBangladeshBarbadosBelarusBelgiumBelizeBoliviaBosnia and HerzegovinaBrazilBulgariaBurma/MyanmarCabo VerdeCambodiaCameroonCanadaCaribbeanCentral AmericaChileChinaColombiaCongoCosta RicaCroatiaCubaCzechoslovakiaDenmarkDominican RepublicEastern AfricaEastern AsiaEastern EuropeEcuadorEgyptEl SalvadorEnglandEritreaEthiopiaEuropeFijiFranceGermanyGhanaGreeceGrenadaGuatemalaGuyanaHaitiHondurasHong KongHungaryIndiaIndonesiaIranIraqIrelandIsraelItalyJamaicaJapanJordanKazakhstanKenyaKoreaKuwaitLaosLatin AmericaLatviaLebanonLiberiaLithuaniaMalaysiaMexicoMicronesiaMiddle AfricaMoldovaMoroccoNepalNetherlandsNicaraguaNigeriaNorth AmericaNorth MacedoniaNorthern AfricaNorthern EuropeNorwayOceaniaPakistanPanamaPeruPhilippinesPolandPortugalRomaniaRussiaSaudi ArabiaScotlandSenegalSerbiaSierra LeoneSingaporeSomaliaSouth AfricaSouth AmericaSouth Central AsiaSouth Eastern AsiaSouthern EuropeSpainSri LankaSt. Vincent and the GrenadinesSudanSwedenSwitzerlandSyriaTaiwanThailandTrinidad and TobagoTurkeyUgandaUkraineUruguayUzbekistanVenezuelaVietnamWest IndiesWestern AfricaWestern AsiaWestern EuropeYemenZaireZimbabweAzores
Doctorate Degree
Income
Poverty
Unemployment
Labor Participation
Family Structure
Vehicle Availability
Education Level
Disability

Doctorate Degree Comparison

Immigrants from Dominica

Immigrants from Canada

Tragic
Exceptional
1.4%
DOCTORATE DEGREE
0.1/ 100
METRIC RATING
303rd/ 347
METRIC RANK
2.3%
DOCTORATE DEGREE
99.8/ 100
METRIC RATING
72nd/ 347
METRIC RANK

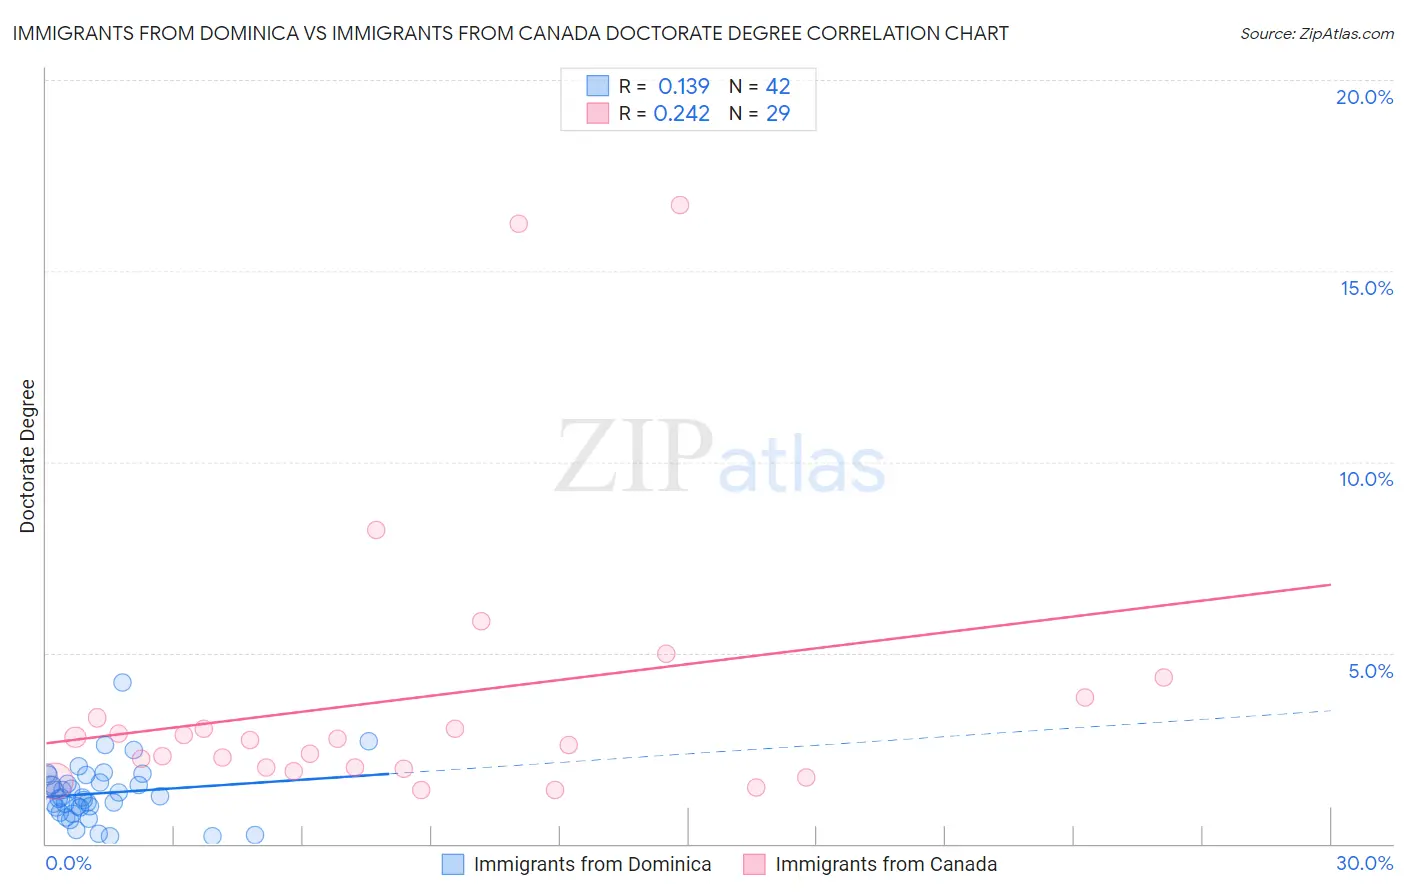
Immigrants from Dominica vs Immigrants from Canada Doctorate Degree Correlation Chart

The statistical analysis conducted on geographies consisting of 83,662,569 people shows a poor positive correlation between the proportion of Immigrants from Dominica and percentage of population with at least doctorate degree education in the United States with a correlation coefficient (R) of 0.139 and weighted average of 1.4%. Similarly, the statistical analysis conducted on geographies consisting of 452,998,134 people shows a weak positive correlation between the proportion of Immigrants from Canada and percentage of population with at least doctorate degree education in the United States with a correlation coefficient (R) of 0.242 and weighted average of 2.3%, a difference of 63.0%.
Immigrants from Dominica vs Immigrants from Canada Doctorate Degree

Doctorate Degree Correlation Summary

MeasurementImmigrants from DominicaImmigrants from Canada
Minimum0.18%1.4%
Maximum4.2%16.7%
Range4.1%15.3%
Mean1.3%3.8%
Median1.2%2.7%
Interquartile 25% (IQ1)0.94%2.0%
Interquartile 75% (IQ3)1.6%3.6%
Interquartile Range (IQR)0.67%1.6%
Standard Deviation (Sample)0.76%3.8%
Standard Deviation (Population)0.75%3.7%

Similar Demographics by Doctorate Degree

Demographics Similar to Immigrants from Dominica by Doctorate Degree

In terms of doctorate degree, the demographic groups most similar to Immigrants from Dominica are Shoshone (1.4%, a difference of 0.030%), Mexican American Indian (1.4%, a difference of 0.060%), Pennsylvania German (1.4%, a difference of 0.19%), Guyanese (1.4%, a difference of 0.20%), and Honduran (1.4%, a difference of 0.36%).
DemographicsRating | RankDoctorate Degree
Immigrants | Ecuador
0.2
/100
|
#296
Tragic
1.4%
Tsimshian
0.2
/100
|
#297
Tragic
1.4%
Puerto Ricans
0.1
/100
|
#298
Tragic
1.4%
Belizeans
0.1
/100
|
#299
Tragic
1.4%
Immigrants | Guatemala
0.1
/100
|
#300
Tragic
1.4%
Hondurans
0.1
/100
|
#301
Tragic
1.4%
Shoshone
0.1
/100
|
#302
Tragic
1.4%
Immigrants | Dominica
0.1
/100
|
#303
Tragic
1.4%
Mexican American Indians
0.1
/100
|
#304
Tragic
1.4%
Pennsylvania Germans
0.1
/100
|
#305
Tragic
1.4%
Guyanese
0.1
/100
|
#306
Tragic
1.4%
Cubans
0.1
/100
|
#307
Tragic
1.4%
Immigrants | Laos
0.1
/100
|
#308
Tragic
1.4%
Immigrants | Grenada
0.1
/100
|
#309
Tragic
1.4%
Immigrants | Jamaica
0.1
/100
|
#310
Tragic
1.4%

Demographics Similar to Immigrants from Canada by Doctorate Degree

In terms of doctorate degree, the demographic groups most similar to Immigrants from Canada are Immigrants from Bulgaria (2.3%, a difference of 0.080%), Lithuanian (2.3%, a difference of 0.16%), Immigrants from Bolivia (2.3%, a difference of 0.16%), Immigrants from North America (2.2%, a difference of 0.22%), and Carpatho Rusyn (2.3%, a difference of 0.30%).
DemographicsRating | RankDoctorate Degree
Paraguayans
99.9
/100
|
#65
Exceptional
2.3%
Argentineans
99.9
/100
|
#66
Exceptional
2.3%
Zimbabweans
99.8
/100
|
#67
Exceptional
2.3%
Immigrants | Kazakhstan
99.8
/100
|
#68
Exceptional
2.3%
Carpatho Rusyns
99.8
/100
|
#69
Exceptional
2.3%
Lithuanians
99.8
/100
|
#70
Exceptional
2.3%
Immigrants | Bolivia
99.8
/100
|
#71
Exceptional
2.3%
Immigrants | Canada
99.8
/100
|
#72
Exceptional
2.3%
Immigrants | Bulgaria
99.8
/100
|
#73
Exceptional
2.3%
Immigrants | North America
99.8
/100
|
#74
Exceptional
2.2%
Immigrants | Western Asia
99.8
/100
|
#75
Exceptional
2.2%
Immigrants | Hungary
99.8
/100
|
#76
Exceptional
2.2%
Immigrants | Lebanon
99.8
/100
|
#77
Exceptional
2.2%
Immigrants | Belarus
99.7
/100
|
#78
Exceptional
2.2%
Northern Europeans
99.7
/100
|
#79
Exceptional
2.2%