Choctaw vs Immigrants from Canada Doctorate Degree
COMPARE
Choctaw
Immigrants from Canada
Doctorate Degree
Doctorate Degree Comparison
Choctaw
Immigrants from Canada
1.4%
DOCTORATE DEGREE
0.3/ 100
METRIC RATING
290th/ 347
METRIC RANK
2.3%
DOCTORATE DEGREE
99.8/ 100
METRIC RATING
72nd/ 347
METRIC RANK
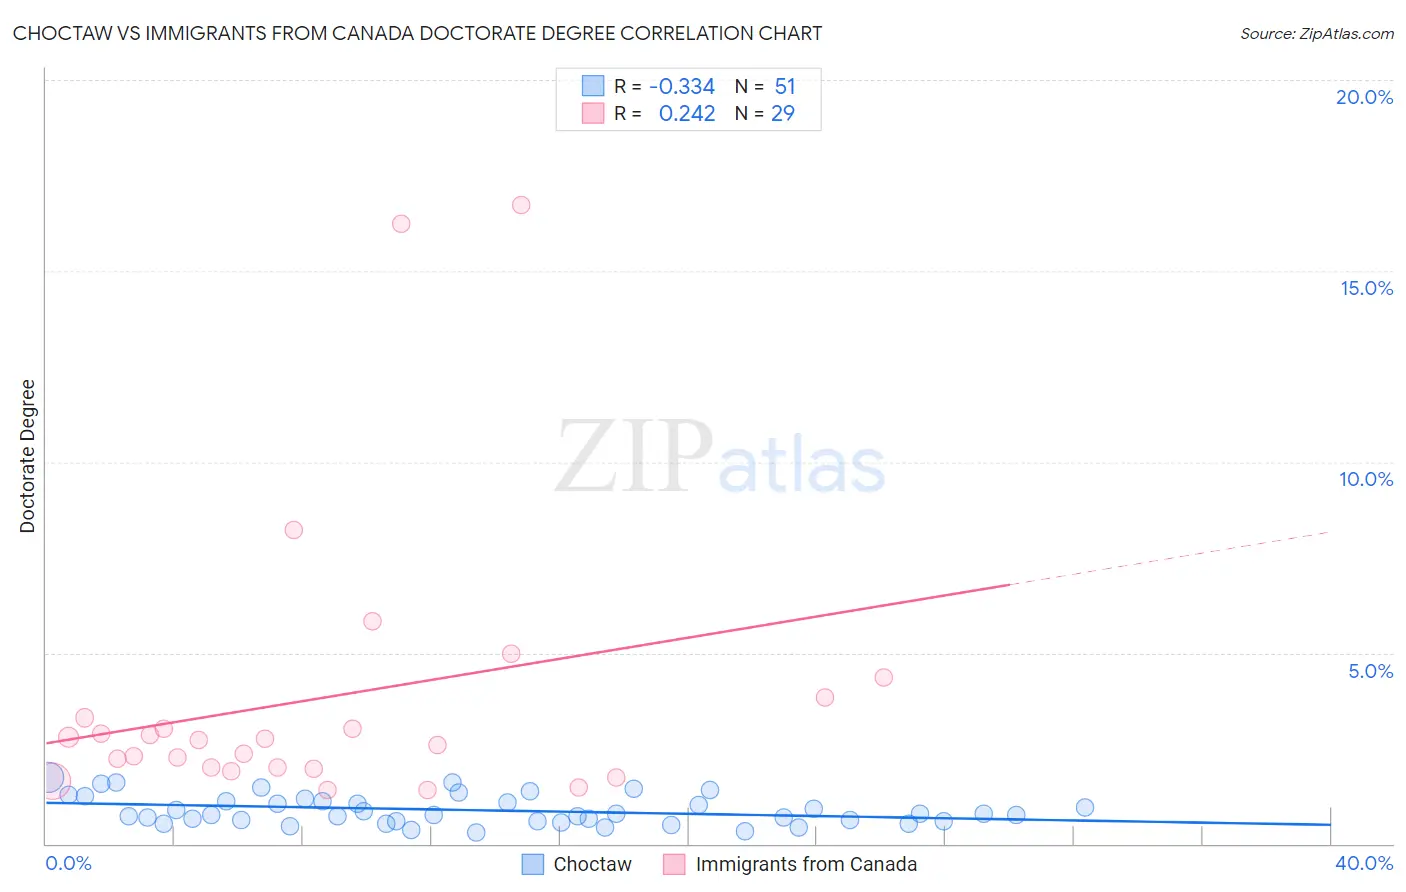
Choctaw vs Immigrants from Canada Doctorate Degree Correlation Chart
The statistical analysis conducted on geographies consisting of 265,489,053 people shows a mild negative correlation between the proportion of Choctaw and percentage of population with at least doctorate degree education in the United States with a correlation coefficient (R) of -0.334 and weighted average of 1.4%. Similarly, the statistical analysis conducted on geographies consisting of 452,998,134 people shows a weak positive correlation between the proportion of Immigrants from Canada and percentage of population with at least doctorate degree education in the United States with a correlation coefficient (R) of 0.242 and weighted average of 2.3%, a difference of 55.9%.
Doctorate Degree Correlation Summary
| Measurement | Choctaw | Immigrants from Canada |
| Minimum | 0.28% | 1.4% |
| Maximum | 1.7% | 16.7% |
| Range | 1.5% | 15.3% |
| Mean | 0.88% | 3.8% |
| Median | 0.76% | 2.7% |
| Interquartile 25% (IQ1) | 0.59% | 2.0% |
| Interquartile 75% (IQ3) | 1.1% | 3.6% |
| Interquartile Range (IQR) | 0.54% | 1.6% |
| Standard Deviation (Sample) | 0.38% | 3.8% |
| Standard Deviation (Population) | 0.38% | 3.7% |
Similar Demographics by Doctorate Degree
Demographics Similar to Choctaw by Doctorate Degree
In terms of doctorate degree, the demographic groups most similar to Choctaw are Cape Verdean (1.4%, a difference of 0.020%), Immigrants from El Salvador (1.4%, a difference of 0.15%), Black/African American (1.4%, a difference of 0.23%), Cajun (1.5%, a difference of 0.33%), and Alaska Native (1.4%, a difference of 0.40%).
| Demographics | Rating | Rank | Doctorate Degree |
| Central Americans | 0.3 /100 | #283 | Tragic 1.5% |
| Jamaicans | 0.3 /100 | #284 | Tragic 1.5% |
| Malaysians | 0.3 /100 | #285 | Tragic 1.5% |
| Cherokee | 0.3 /100 | #286 | Tragic 1.5% |
| Cajuns | 0.3 /100 | #287 | Tragic 1.5% |
| Immigrants | El Salvador | 0.3 /100 | #288 | Tragic 1.4% |
| Cape Verdeans | 0.3 /100 | #289 | Tragic 1.4% |
| Choctaw | 0.3 /100 | #290 | Tragic 1.4% |
| Blacks/African Americans | 0.3 /100 | #291 | Tragic 1.4% |
| Alaska Natives | 0.3 /100 | #292 | Tragic 1.4% |
| Immigrants | Yemen | 0.2 /100 | #293 | Tragic 1.4% |
| Samoans | 0.2 /100 | #294 | Tragic 1.4% |
| Guatemalans | 0.2 /100 | #295 | Tragic 1.4% |
| Immigrants | Ecuador | 0.2 /100 | #296 | Tragic 1.4% |
| Tsimshian | 0.2 /100 | #297 | Tragic 1.4% |
Demographics Similar to Immigrants from Canada by Doctorate Degree
In terms of doctorate degree, the demographic groups most similar to Immigrants from Canada are Immigrants from Bulgaria (2.3%, a difference of 0.080%), Lithuanian (2.3%, a difference of 0.16%), Immigrants from Bolivia (2.3%, a difference of 0.16%), Immigrants from North America (2.2%, a difference of 0.22%), and Carpatho Rusyn (2.3%, a difference of 0.30%).
| Demographics | Rating | Rank | Doctorate Degree |
| Paraguayans | 99.9 /100 | #65 | Exceptional 2.3% |
| Argentineans | 99.9 /100 | #66 | Exceptional 2.3% |
| Zimbabweans | 99.8 /100 | #67 | Exceptional 2.3% |
| Immigrants | Kazakhstan | 99.8 /100 | #68 | Exceptional 2.3% |
| Carpatho Rusyns | 99.8 /100 | #69 | Exceptional 2.3% |
| Lithuanians | 99.8 /100 | #70 | Exceptional 2.3% |
| Immigrants | Bolivia | 99.8 /100 | #71 | Exceptional 2.3% |
| Immigrants | Canada | 99.8 /100 | #72 | Exceptional 2.3% |
| Immigrants | Bulgaria | 99.8 /100 | #73 | Exceptional 2.3% |
| Immigrants | North America | 99.8 /100 | #74 | Exceptional 2.2% |
| Immigrants | Western Asia | 99.8 /100 | #75 | Exceptional 2.2% |
| Immigrants | Hungary | 99.8 /100 | #76 | Exceptional 2.2% |
| Immigrants | Lebanon | 99.8 /100 | #77 | Exceptional 2.2% |
| Immigrants | Belarus | 99.7 /100 | #78 | Exceptional 2.2% |
| Northern Europeans | 99.7 /100 | #79 | Exceptional 2.2% |