Icelander vs Apache Doctorate Degree
COMPARE
Icelander
Apache
Doctorate Degree
Doctorate Degree Comparison
Icelanders
Apache
2.1%
DOCTORATE DEGREE
96.0/ 100
METRIC RATING
118th/ 347
METRIC RANK
1.5%
DOCTORATE DEGREE
1.3/ 100
METRIC RATING
251st/ 347
METRIC RANK
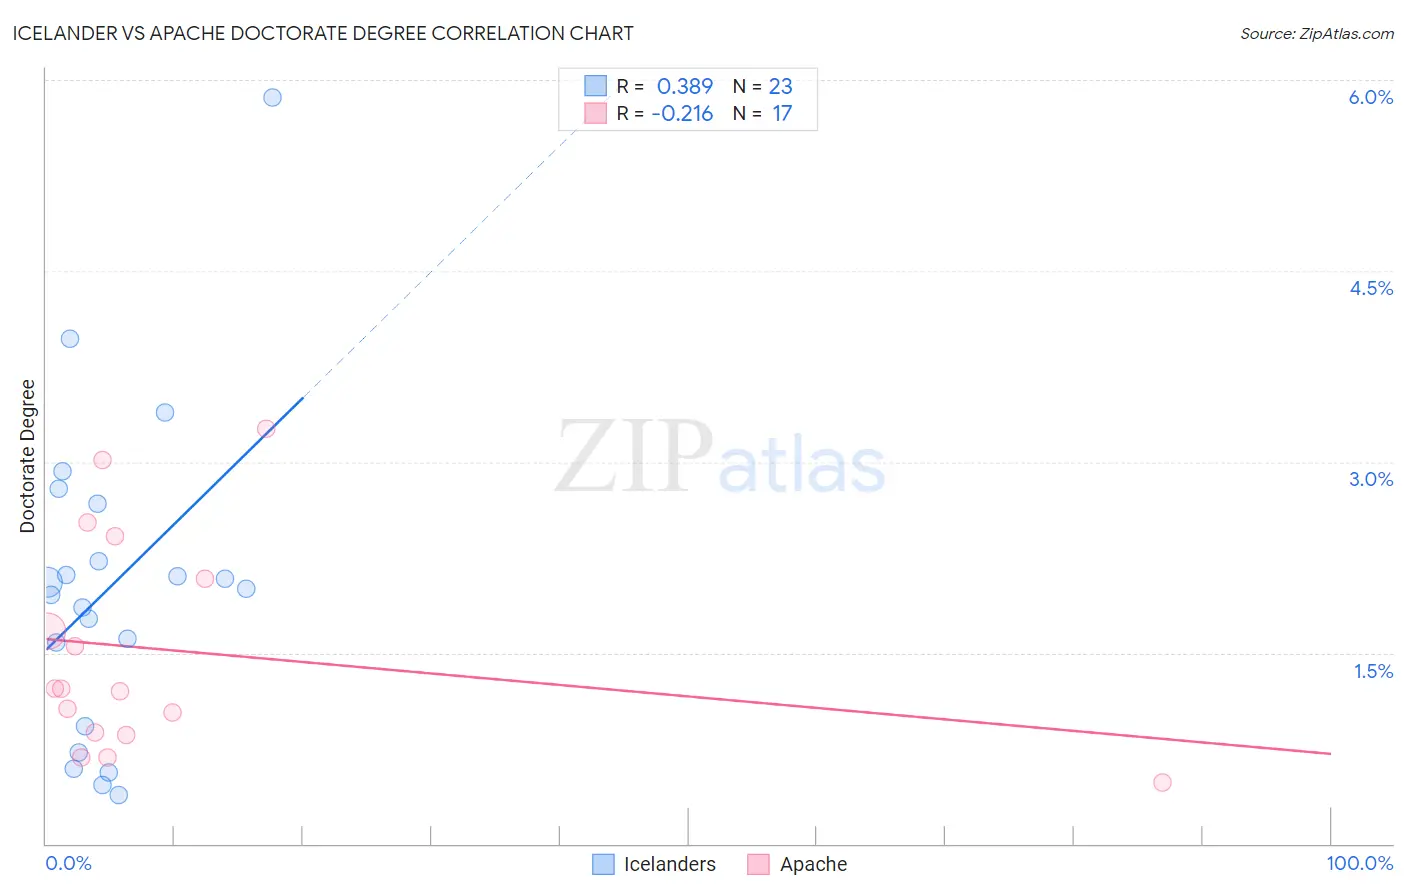
Icelander vs Apache Doctorate Degree Correlation Chart
The statistical analysis conducted on geographies consisting of 159,042,480 people shows a mild positive correlation between the proportion of Icelanders and percentage of population with at least doctorate degree education in the United States with a correlation coefficient (R) of 0.389 and weighted average of 2.1%. Similarly, the statistical analysis conducted on geographies consisting of 228,067,045 people shows a weak negative correlation between the proportion of Apache and percentage of population with at least doctorate degree education in the United States with a correlation coefficient (R) of -0.216 and weighted average of 1.5%, a difference of 32.7%.
Doctorate Degree Correlation Summary
| Measurement | Icelander | Apache |
| Minimum | 0.38% | 0.48% |
| Maximum | 5.9% | 3.3% |
| Range | 5.5% | 2.8% |
| Mean | 2.0% | 1.5% |
| Median | 2.0% | 1.2% |
| Interquartile 25% (IQ1) | 0.93% | 0.86% |
| Interquartile 75% (IQ3) | 2.7% | 2.3% |
| Interquartile Range (IQR) | 1.7% | 1.4% |
| Standard Deviation (Sample) | 1.3% | 0.85% |
| Standard Deviation (Population) | 1.2% | 0.82% |
Similar Demographics by Doctorate Degree
Demographics Similar to Icelanders by Doctorate Degree
In terms of doctorate degree, the demographic groups most similar to Icelanders are Lebanese (2.1%, a difference of 0.040%), Pakistani (2.0%, a difference of 0.13%), Maltese (2.1%, a difference of 0.21%), Immigrants from Morocco (2.0%, a difference of 0.42%), and Taiwanese (2.1%, a difference of 0.67%).
| Demographics | Rating | Rank | Doctorate Degree |
| Immigrants | Pakistan | 97.1 /100 | #111 | Exceptional 2.1% |
| Syrians | 97.1 /100 | #112 | Exceptional 2.1% |
| Immigrants | Italy | 96.9 /100 | #113 | Exceptional 2.1% |
| Immigrants | Croatia | 96.8 /100 | #114 | Exceptional 2.1% |
| Taiwanese | 96.7 /100 | #115 | Exceptional 2.1% |
| Maltese | 96.2 /100 | #116 | Exceptional 2.1% |
| Lebanese | 96.0 /100 | #117 | Exceptional 2.1% |
| Icelanders | 96.0 /100 | #118 | Exceptional 2.1% |
| Pakistanis | 95.8 /100 | #119 | Exceptional 2.0% |
| Immigrants | Morocco | 95.5 /100 | #120 | Exceptional 2.0% |
| Immigrants | Jordan | 94.8 /100 | #121 | Exceptional 2.0% |
| Immigrants | Southern Europe | 94.7 /100 | #122 | Exceptional 2.0% |
| Croatians | 94.0 /100 | #123 | Exceptional 2.0% |
| Ute | 93.2 /100 | #124 | Exceptional 2.0% |
| Moroccans | 93.0 /100 | #125 | Exceptional 2.0% |
Demographics Similar to Apache by Doctorate Degree
In terms of doctorate degree, the demographic groups most similar to Apache are Immigrants from Fiji (1.6%, a difference of 0.87%), Potawatomi (1.6%, a difference of 0.90%), Yuman (1.5%, a difference of 0.92%), American (1.5%, a difference of 1.1%), and Immigrants from Cambodia (1.5%, a difference of 1.2%).
| Demographics | Rating | Rank | Doctorate Degree |
| French American Indians | 2.0 /100 | #244 | Tragic 1.6% |
| Delaware | 1.9 /100 | #245 | Tragic 1.6% |
| Hmong | 1.8 /100 | #246 | Tragic 1.6% |
| Comanche | 1.8 /100 | #247 | Tragic 1.6% |
| Africans | 1.8 /100 | #248 | Tragic 1.6% |
| Potawatomi | 1.6 /100 | #249 | Tragic 1.6% |
| Immigrants | Fiji | 1.6 /100 | #250 | Tragic 1.6% |
| Apache | 1.3 /100 | #251 | Tragic 1.5% |
| Yuman | 1.1 /100 | #252 | Tragic 1.5% |
| Americans | 1.0 /100 | #253 | Tragic 1.5% |
| Immigrants | Cambodia | 1.0 /100 | #254 | Tragic 1.5% |
| Trinidadians and Tobagonians | 1.0 /100 | #255 | Tragic 1.5% |
| Central American Indians | 1.0 /100 | #256 | Tragic 1.5% |
| Chippewa | 0.9 /100 | #257 | Tragic 1.5% |
| Immigrants | West Indies | 0.9 /100 | #258 | Tragic 1.5% |