Icelander vs Thai 6th Grade
COMPARE
Icelander
Thai
6th Grade
6th Grade Comparison
Icelanders
Thais
97.6%
6TH GRADE
99.3/ 100
METRIC RATING
78th/ 347
METRIC RANK
97.4%
6TH GRADE
96.9/ 100
METRIC RATING
110th/ 347
METRIC RANK
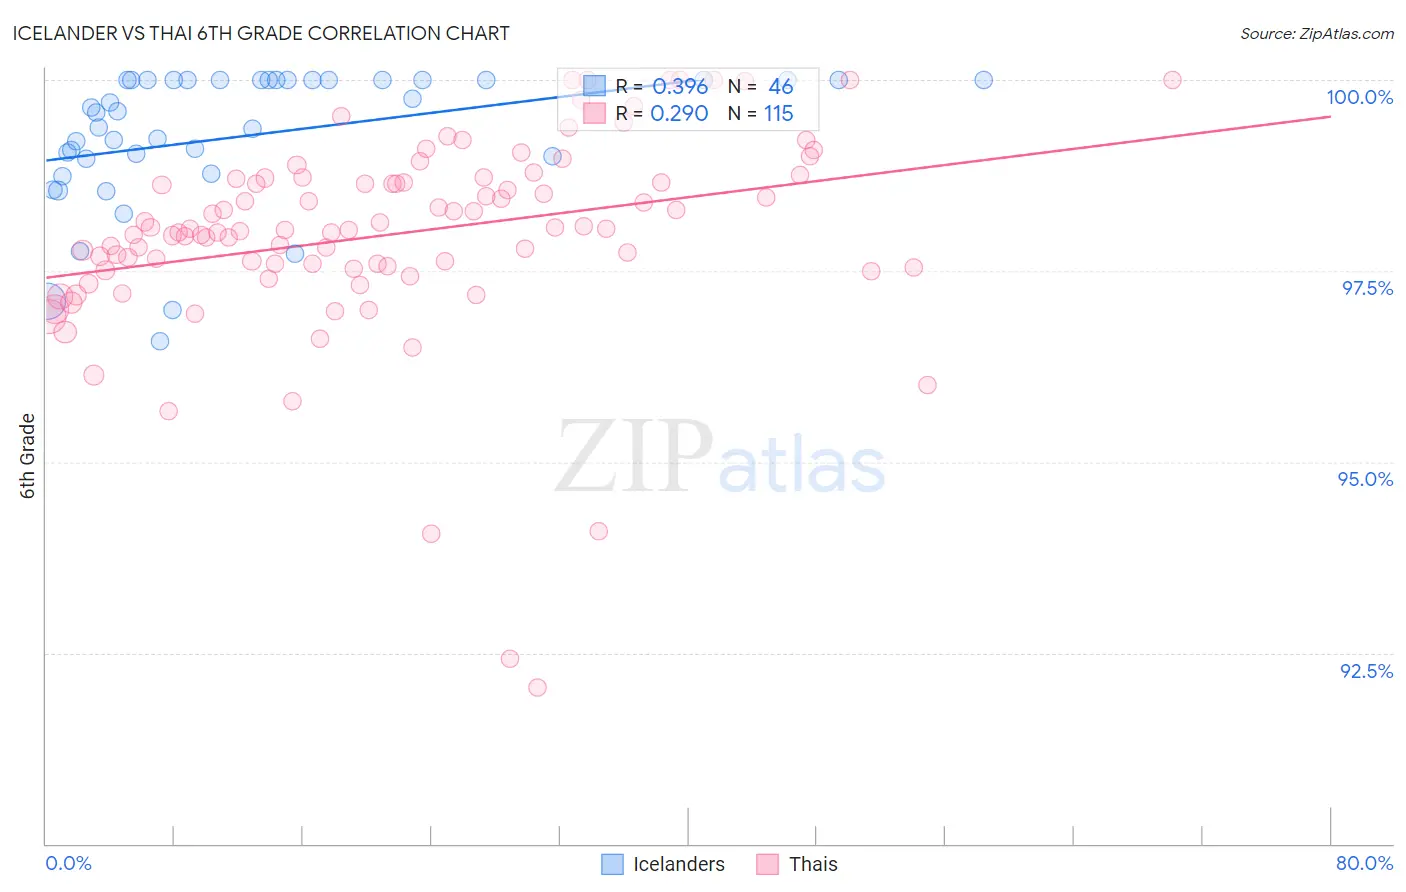
Icelander vs Thai 6th Grade Correlation Chart
The statistical analysis conducted on geographies consisting of 159,668,975 people shows a mild positive correlation between the proportion of Icelanders and percentage of population with at least 6th grade education in the United States with a correlation coefficient (R) of 0.396 and weighted average of 97.6%. Similarly, the statistical analysis conducted on geographies consisting of 475,866,115 people shows a weak positive correlation between the proportion of Thais and percentage of population with at least 6th grade education in the United States with a correlation coefficient (R) of 0.290 and weighted average of 97.4%, a difference of 0.17%.
6th Grade Correlation Summary
| Measurement | Icelander | Thai |
| Minimum | 96.6% | 92.1% |
| Maximum | 100.0% | 100.0% |
| Range | 3.4% | 7.9% |
| Mean | 99.3% | 98.0% |
| Median | 99.6% | 98.0% |
| Interquartile 25% (IQ1) | 99.0% | 97.5% |
| Interquartile 75% (IQ3) | 100.0% | 98.7% |
| Interquartile Range (IQR) | 1.0% | 1.2% |
| Standard Deviation (Sample) | 0.90% | 1.3% |
| Standard Deviation (Population) | 0.89% | 1.3% |
Similar Demographics by 6th Grade
Demographics Similar to Icelanders by 6th Grade
In terms of 6th grade, the demographic groups most similar to Icelanders are Immigrants from Lithuania (97.6%, a difference of 0.0%), Immigrants from India (97.6%, a difference of 0.0%), Ukrainian (97.6%, a difference of 0.010%), Immigrants from England (97.6%, a difference of 0.010%), and Osage (97.6%, a difference of 0.010%).
| Demographics | Rating | Rank | 6th Grade |
| Chickasaw | 99.5 /100 | #71 | Exceptional 97.6% |
| Macedonians | 99.4 /100 | #72 | Exceptional 97.6% |
| Cherokee | 99.4 /100 | #73 | Exceptional 97.6% |
| Immigrants | Netherlands | 99.4 /100 | #74 | Exceptional 97.6% |
| Ukrainians | 99.4 /100 | #75 | Exceptional 97.6% |
| Immigrants | England | 99.4 /100 | #76 | Exceptional 97.6% |
| Immigrants | Lithuania | 99.3 /100 | #77 | Exceptional 97.6% |
| Icelanders | 99.3 /100 | #78 | Exceptional 97.6% |
| Immigrants | India | 99.3 /100 | #79 | Exceptional 97.6% |
| Osage | 99.3 /100 | #80 | Exceptional 97.6% |
| Lumbee | 99.2 /100 | #81 | Exceptional 97.6% |
| Zimbabweans | 99.1 /100 | #82 | Exceptional 97.6% |
| Potawatomi | 99.1 /100 | #83 | Exceptional 97.6% |
| Shoshone | 99.0 /100 | #84 | Exceptional 97.6% |
| Delaware | 98.9 /100 | #85 | Exceptional 97.6% |
Demographics Similar to Thais by 6th Grade
In terms of 6th grade, the demographic groups most similar to Thais are Iroquois (97.4%, a difference of 0.0%), Immigrants from Latvia (97.4%, a difference of 0.010%), Nonimmigrants (97.4%, a difference of 0.020%), Immigrants from Czechoslovakia (97.4%, a difference of 0.020%), and Immigrants from Saudi Arabia (97.4%, a difference of 0.020%).
| Demographics | Rating | Rank | 6th Grade |
| Bhutanese | 98.0 /100 | #103 | Exceptional 97.5% |
| German Russians | 97.9 /100 | #104 | Exceptional 97.5% |
| Cheyenne | 97.9 /100 | #105 | Exceptional 97.5% |
| Menominee | 97.7 /100 | #106 | Exceptional 97.5% |
| Immigrants | Singapore | 97.6 /100 | #107 | Exceptional 97.5% |
| Immigrants | Nonimmigrants | 97.3 /100 | #108 | Exceptional 97.4% |
| Immigrants | Czechoslovakia | 97.3 /100 | #109 | Exceptional 97.4% |
| Thais | 96.9 /100 | #110 | Exceptional 97.4% |
| Iroquois | 96.9 /100 | #111 | Exceptional 97.4% |
| Immigrants | Latvia | 96.7 /100 | #112 | Exceptional 97.4% |
| Immigrants | Saudi Arabia | 96.5 /100 | #113 | Exceptional 97.4% |
| Colville | 96.4 /100 | #114 | Exceptional 97.4% |
| Immigrants | Switzerland | 95.7 /100 | #115 | Exceptional 97.4% |
| Lebanese | 95.5 /100 | #116 | Exceptional 97.4% |
| Basques | 95.4 /100 | #117 | Exceptional 97.4% |