Immigrants from St. Vincent and the Grenadines vs Czechoslovakian 11th Grade
COMPARE
Immigrants from St. Vincent and the Grenadines
Czechoslovakian
11th Grade
11th Grade Comparison
Immigrants from St. Vincent and the Grenadines
Czechoslovakians
90.7%
11TH GRADE
0.0/ 100
METRIC RATING
282nd/ 347
METRIC RANK
94.0%
11TH GRADE
99.9/ 100
METRIC RATING
55th/ 347
METRIC RANK
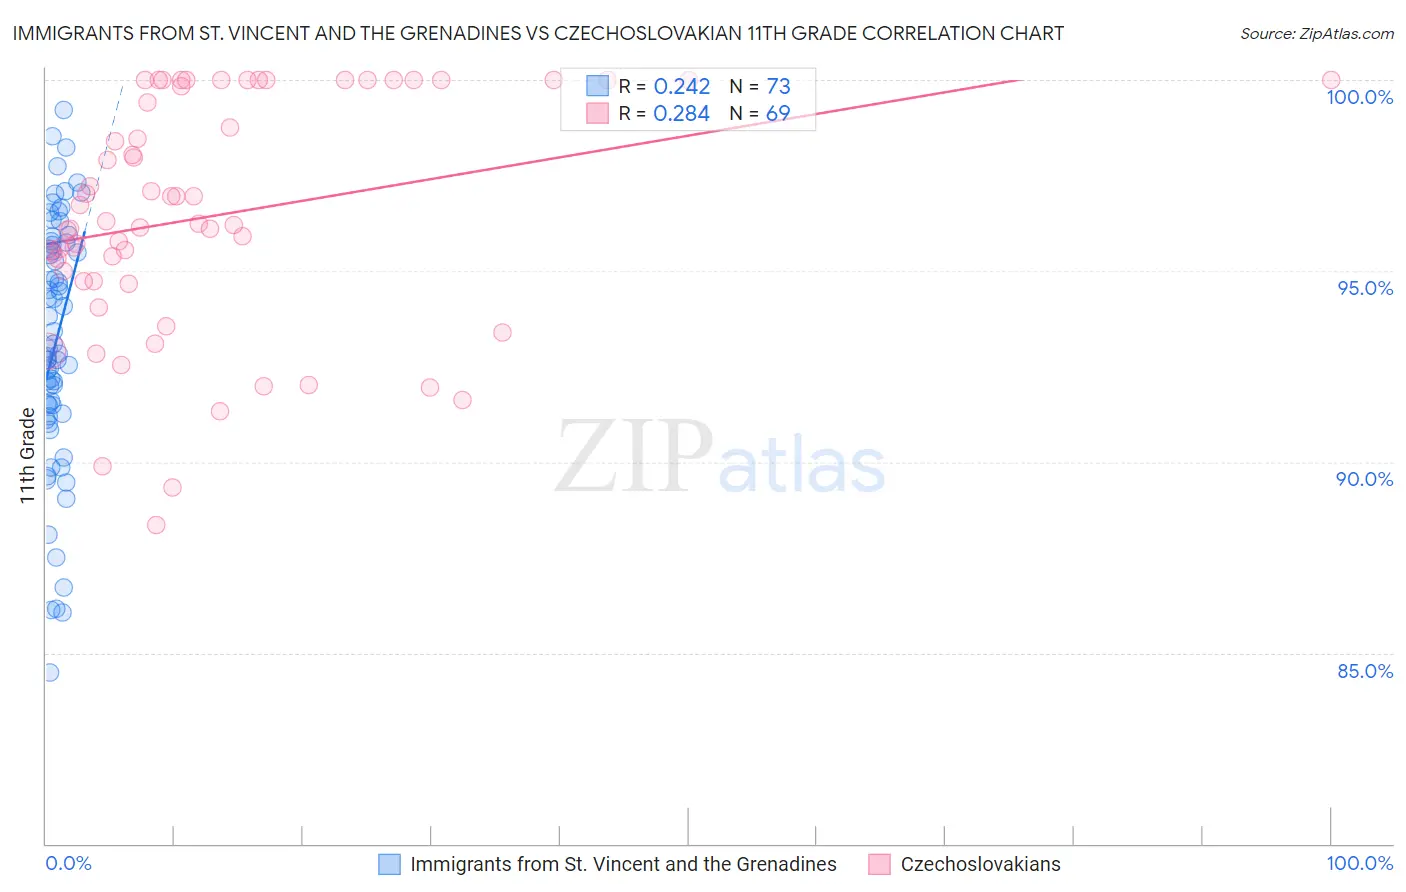
Immigrants from St. Vincent and the Grenadines vs Czechoslovakian 11th Grade Correlation Chart
The statistical analysis conducted on geographies consisting of 56,191,418 people shows a weak positive correlation between the proportion of Immigrants from St. Vincent and the Grenadines and percentage of population with at least 11th grade education in the United States with a correlation coefficient (R) of 0.242 and weighted average of 90.7%. Similarly, the statistical analysis conducted on geographies consisting of 368,668,876 people shows a weak positive correlation between the proportion of Czechoslovakians and percentage of population with at least 11th grade education in the United States with a correlation coefficient (R) of 0.284 and weighted average of 94.0%, a difference of 3.7%.
11th Grade Correlation Summary
| Measurement | Immigrants from St. Vincent and the Grenadines | Czechoslovakian |
| Minimum | 84.5% | 88.3% |
| Maximum | 99.2% | 100.0% |
| Range | 14.7% | 11.7% |
| Mean | 93.1% | 96.4% |
| Median | 93.0% | 96.2% |
| Interquartile 25% (IQ1) | 91.2% | 94.7% |
| Interquartile 75% (IQ3) | 95.7% | 100.0% |
| Interquartile Range (IQR) | 4.5% | 5.3% |
| Standard Deviation (Sample) | 3.3% | 3.1% |
| Standard Deviation (Population) | 3.3% | 3.0% |
Similar Demographics by 11th Grade
Demographics Similar to Immigrants from St. Vincent and the Grenadines by 11th Grade
In terms of 11th grade, the demographic groups most similar to Immigrants from St. Vincent and the Grenadines are Dutch West Indian (90.7%, a difference of 0.010%), Immigrants from Barbados (90.7%, a difference of 0.010%), Sri Lankan (90.7%, a difference of 0.060%), Barbadian (90.8%, a difference of 0.13%), and Malaysian (90.8%, a difference of 0.17%).
| Demographics | Rating | Rank | 11th Grade |
| Immigrants | South Eastern Asia | 0.1 /100 | #275 | Tragic 90.9% |
| Bangladeshis | 0.1 /100 | #276 | Tragic 90.9% |
| Immigrants | Congo | 0.1 /100 | #277 | Tragic 90.9% |
| Malaysians | 0.1 /100 | #278 | Tragic 90.8% |
| Barbadians | 0.0 /100 | #279 | Tragic 90.8% |
| Sri Lankans | 0.0 /100 | #280 | Tragic 90.7% |
| Dutch West Indians | 0.0 /100 | #281 | Tragic 90.7% |
| Immigrants | St. Vincent and the Grenadines | 0.0 /100 | #282 | Tragic 90.7% |
| Immigrants | Barbados | 0.0 /100 | #283 | Tragic 90.7% |
| Immigrants | Laos | 0.0 /100 | #284 | Tragic 90.5% |
| Immigrants | Burma/Myanmar | 0.0 /100 | #285 | Tragic 90.4% |
| Immigrants | West Indies | 0.0 /100 | #286 | Tragic 90.4% |
| Apache | 0.0 /100 | #287 | Tragic 90.4% |
| Pennsylvania Germans | 0.0 /100 | #288 | Tragic 90.3% |
| British West Indians | 0.0 /100 | #289 | Tragic 90.3% |
Demographics Similar to Czechoslovakians by 11th Grade
In terms of 11th grade, the demographic groups most similar to Czechoslovakians are Immigrants from North America (94.0%, a difference of 0.0%), Immigrants from Australia (94.0%, a difference of 0.010%), French Canadian (94.0%, a difference of 0.010%), New Zealander (94.0%, a difference of 0.010%), and Iranian (94.0%, a difference of 0.010%).
| Demographics | Rating | Rank | 11th Grade |
| Macedonians | 99.9 /100 | #48 | Exceptional 94.1% |
| Slavs | 99.9 /100 | #49 | Exceptional 94.1% |
| French | 99.9 /100 | #50 | Exceptional 94.1% |
| Turks | 99.9 /100 | #51 | Exceptional 94.0% |
| Immigrants | Canada | 99.9 /100 | #52 | Exceptional 94.0% |
| Immigrants | Australia | 99.9 /100 | #53 | Exceptional 94.0% |
| Immigrants | North America | 99.9 /100 | #54 | Exceptional 94.0% |
| Czechoslovakians | 99.9 /100 | #55 | Exceptional 94.0% |
| French Canadians | 99.9 /100 | #56 | Exceptional 94.0% |
| New Zealanders | 99.9 /100 | #57 | Exceptional 94.0% |
| Iranians | 99.9 /100 | #58 | Exceptional 94.0% |
| Bhutanese | 99.8 /100 | #59 | Exceptional 94.0% |
| Okinawans | 99.8 /100 | #60 | Exceptional 94.0% |
| Immigrants | Belgium | 99.8 /100 | #61 | Exceptional 94.0% |
| Austrians | 99.8 /100 | #62 | Exceptional 94.0% |