Greek vs Yugoslavian 4th Grade
COMPARE
Greek
Yugoslavian
4th Grade
4th Grade Comparison
Greeks
Yugoslavians
98.1%
4TH GRADE
99.8/ 100
METRIC RATING
56th/ 347
METRIC RANK
97.9%
4TH GRADE
98.1/ 100
METRIC RATING
100th/ 347
METRIC RANK
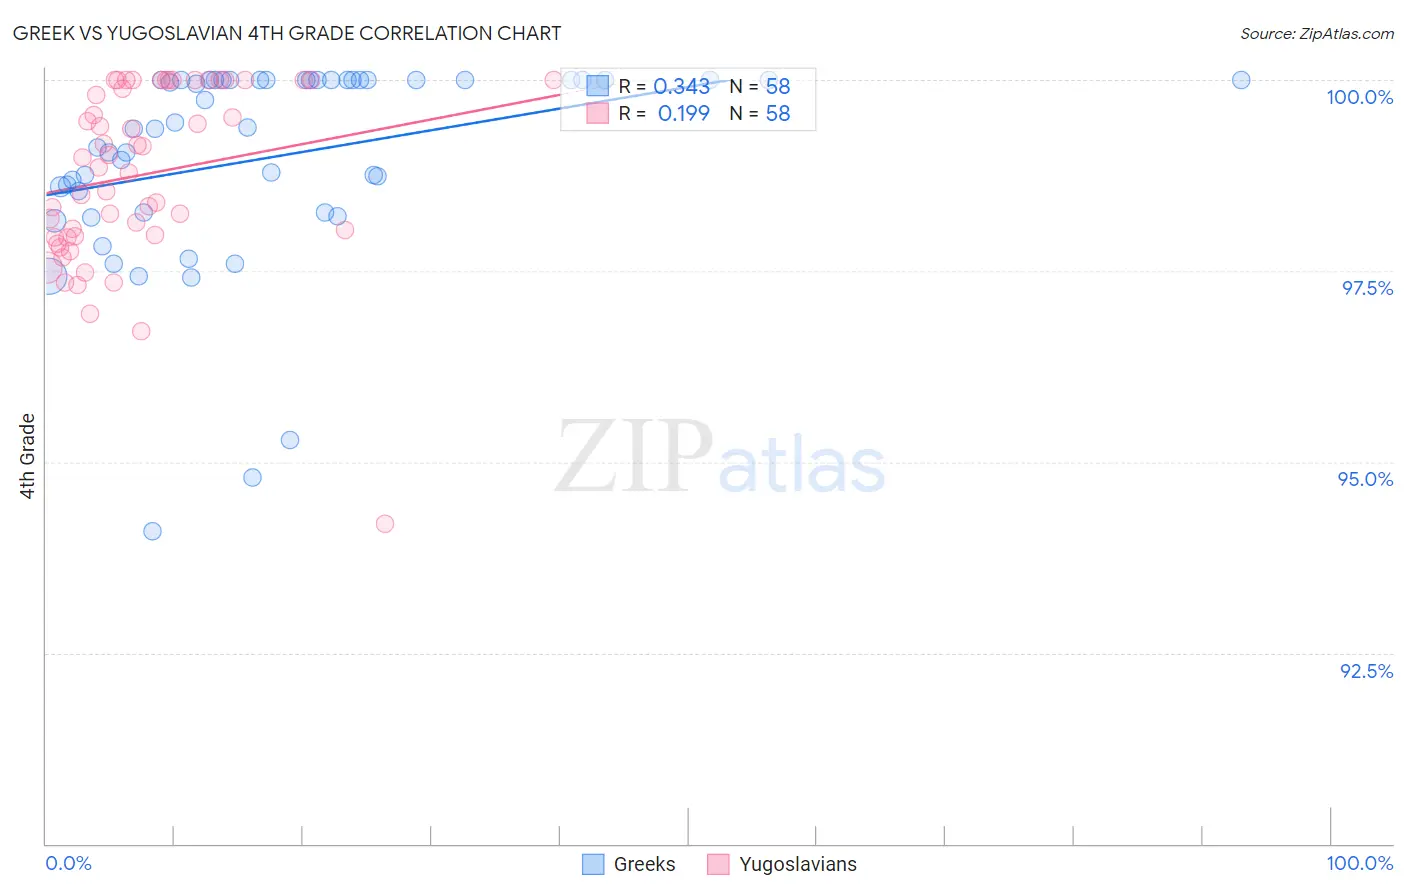
Greek vs Yugoslavian 4th Grade Correlation Chart
The statistical analysis conducted on geographies consisting of 482,775,358 people shows a mild positive correlation between the proportion of Greeks and percentage of population with at least 4th grade education in the United States with a correlation coefficient (R) of 0.343 and weighted average of 98.1%. Similarly, the statistical analysis conducted on geographies consisting of 285,618,157 people shows a poor positive correlation between the proportion of Yugoslavians and percentage of population with at least 4th grade education in the United States with a correlation coefficient (R) of 0.199 and weighted average of 97.9%, a difference of 0.20%.
4th Grade Correlation Summary
| Measurement | Greek | Yugoslavian |
| Minimum | 94.1% | 94.2% |
| Maximum | 100.0% | 100.0% |
| Range | 5.9% | 5.8% |
| Mean | 99.0% | 98.8% |
| Median | 99.4% | 98.9% |
| Interquartile 25% (IQ1) | 98.3% | 97.9% |
| Interquartile 75% (IQ3) | 100.0% | 100.0% |
| Interquartile Range (IQR) | 1.7% | 2.1% |
| Standard Deviation (Sample) | 1.3% | 1.2% |
| Standard Deviation (Population) | 1.3% | 1.2% |
Similar Demographics by 4th Grade
Demographics Similar to Greeks by 4th Grade
In terms of 4th grade, the demographic groups most similar to Greeks are Maltese (98.1%, a difference of 0.0%), White/Caucasian (98.1%, a difference of 0.0%), Austrian (98.1%, a difference of 0.0%), Creek (98.1%, a difference of 0.0%), and Celtic (98.1%, a difference of 0.010%).
| Demographics | Rating | Rank | 4th Grade |
| Bulgarians | 99.8 /100 | #49 | Exceptional 98.1% |
| Immigrants | Scotland | 99.8 /100 | #50 | Exceptional 98.1% |
| Celtics | 99.8 /100 | #51 | Exceptional 98.1% |
| Australians | 99.8 /100 | #52 | Exceptional 98.1% |
| Slavs | 99.8 /100 | #53 | Exceptional 98.1% |
| Maltese | 99.8 /100 | #54 | Exceptional 98.1% |
| Whites/Caucasians | 99.8 /100 | #55 | Exceptional 98.1% |
| Greeks | 99.8 /100 | #56 | Exceptional 98.1% |
| Austrians | 99.8 /100 | #57 | Exceptional 98.1% |
| Creek | 99.8 /100 | #58 | Exceptional 98.1% |
| Americans | 99.8 /100 | #59 | Exceptional 98.1% |
| Immigrants | Canada | 99.7 /100 | #60 | Exceptional 98.1% |
| Immigrants | North America | 99.7 /100 | #61 | Exceptional 98.1% |
| Serbians | 99.7 /100 | #62 | Exceptional 98.1% |
| Russians | 99.7 /100 | #63 | Exceptional 98.0% |
Demographics Similar to Yugoslavians by 4th Grade
In terms of 4th grade, the demographic groups most similar to Yugoslavians are Turkish (97.9%, a difference of 0.0%), Cree (97.9%, a difference of 0.0%), Cheyenne (97.9%, a difference of 0.010%), South African (97.9%, a difference of 0.010%), and Choctaw (97.9%, a difference of 0.010%).
| Demographics | Rating | Rank | 4th Grade |
| Immigrants | Ireland | 98.7 /100 | #93 | Exceptional 97.9% |
| Shoshone | 98.7 /100 | #94 | Exceptional 97.9% |
| Immigrants | Germany | 98.5 /100 | #95 | Exceptional 97.9% |
| Romanians | 98.4 /100 | #96 | Exceptional 97.9% |
| Cheyenne | 98.4 /100 | #97 | Exceptional 97.9% |
| South Africans | 98.2 /100 | #98 | Exceptional 97.9% |
| Turks | 98.2 /100 | #99 | Exceptional 97.9% |
| Yugoslavians | 98.1 /100 | #100 | Exceptional 97.9% |
| Cree | 98.1 /100 | #101 | Exceptional 97.9% |
| Choctaw | 97.9 /100 | #102 | Exceptional 97.9% |
| Puget Sound Salish | 97.7 /100 | #103 | Exceptional 97.9% |
| Immigrants | Nonimmigrants | 97.5 /100 | #104 | Exceptional 97.9% |
| German Russians | 97.5 /100 | #105 | Exceptional 97.9% |
| Immigrants | Czechoslovakia | 97.5 /100 | #106 | Exceptional 97.9% |
| Bhutanese | 97.4 /100 | #107 | Exceptional 97.9% |