Immigrants from Dominican Republic vs Immigrants from Saudi Arabia 9th Grade
COMPARE
Immigrants from Dominican Republic
Immigrants from Saudi Arabia
9th Grade
9th Grade Comparison
Immigrants from Dominican Republic
Immigrants from Saudi Arabia
90.5%
9TH GRADE
0.0/ 100
METRIC RATING
336th/ 347
METRIC RANK
95.6%
9TH GRADE
98.8/ 100
METRIC RATING
92nd/ 347
METRIC RANK
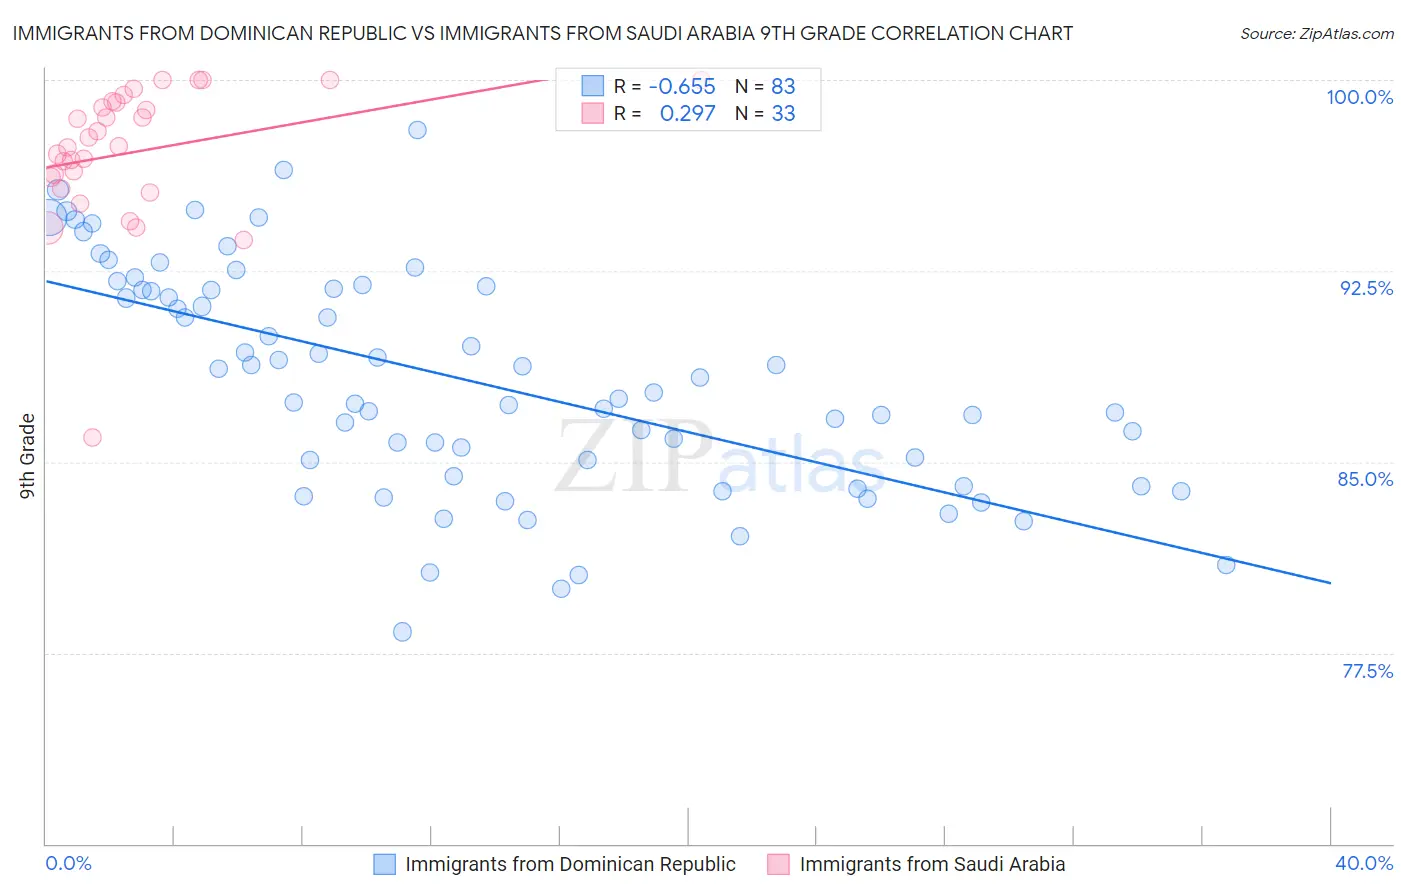
Immigrants from Dominican Republic vs Immigrants from Saudi Arabia 9th Grade Correlation Chart
The statistical analysis conducted on geographies consisting of 275,144,349 people shows a significant negative correlation between the proportion of Immigrants from Dominican Republic and percentage of population with at least 9th grade education in the United States with a correlation coefficient (R) of -0.655 and weighted average of 90.5%. Similarly, the statistical analysis conducted on geographies consisting of 164,277,573 people shows a weak positive correlation between the proportion of Immigrants from Saudi Arabia and percentage of population with at least 9th grade education in the United States with a correlation coefficient (R) of 0.297 and weighted average of 95.6%, a difference of 5.7%.
9th Grade Correlation Summary
| Measurement | Immigrants from Dominican Republic | Immigrants from Saudi Arabia |
| Minimum | 78.3% | 85.9% |
| Maximum | 98.1% | 100.0% |
| Range | 19.7% | 14.1% |
| Mean | 88.2% | 97.2% |
| Median | 87.7% | 97.4% |
| Interquartile 25% (IQ1) | 84.5% | 96.0% |
| Interquartile 75% (IQ3) | 91.8% | 99.1% |
| Interquartile Range (IQR) | 7.3% | 3.2% |
| Standard Deviation (Sample) | 4.4% | 2.8% |
| Standard Deviation (Population) | 4.4% | 2.7% |
Similar Demographics by 9th Grade
Demographics Similar to Immigrants from Dominican Republic by 9th Grade
In terms of 9th grade, the demographic groups most similar to Immigrants from Dominican Republic are Immigrants from Latin America (90.4%, a difference of 0.12%), Central American (90.4%, a difference of 0.13%), Immigrants from Honduras (90.6%, a difference of 0.14%), Immigrants from the Azores (90.8%, a difference of 0.31%), and Immigrants from Yemen (90.8%, a difference of 0.36%).
| Demographics | Rating | Rank | 9th Grade |
| Hondurans | 0.0 /100 | #329 | Tragic 91.0% |
| Immigrants | Cabo Verde | 0.0 /100 | #330 | Tragic 90.9% |
| Mexican American Indians | 0.0 /100 | #331 | Tragic 90.9% |
| Hispanics or Latinos | 0.0 /100 | #332 | Tragic 90.9% |
| Immigrants | Yemen | 0.0 /100 | #333 | Tragic 90.8% |
| Immigrants | Azores | 0.0 /100 | #334 | Tragic 90.8% |
| Immigrants | Honduras | 0.0 /100 | #335 | Tragic 90.6% |
| Immigrants | Dominican Republic | 0.0 /100 | #336 | Tragic 90.5% |
| Immigrants | Latin America | 0.0 /100 | #337 | Tragic 90.4% |
| Central Americans | 0.0 /100 | #338 | Tragic 90.4% |
| Yakama | 0.0 /100 | #339 | Tragic 90.1% |
| Mexicans | 0.0 /100 | #340 | Tragic 90.0% |
| Guatemalans | 0.0 /100 | #341 | Tragic 89.9% |
| Salvadorans | 0.0 /100 | #342 | Tragic 89.6% |
| Immigrants | Guatemala | 0.0 /100 | #343 | Tragic 89.4% |
Demographics Similar to Immigrants from Saudi Arabia by 9th Grade
In terms of 9th grade, the demographic groups most similar to Immigrants from Saudi Arabia are Creek (95.6%, a difference of 0.0%), South African (95.6%, a difference of 0.010%), Immigrants from Germany (95.6%, a difference of 0.010%), Immigrants from Latvia (95.6%, a difference of 0.010%), and Immigrants from Czechoslovakia (95.7%, a difference of 0.020%).
| Demographics | Rating | Rank | 9th Grade |
| Icelanders | 99.1 /100 | #85 | Exceptional 95.7% |
| Immigrants | Western Europe | 99.1 /100 | #86 | Exceptional 95.7% |
| Okinawans | 99.0 /100 | #87 | Exceptional 95.7% |
| Immigrants | Czechoslovakia | 98.9 /100 | #88 | Exceptional 95.7% |
| Yugoslavians | 98.9 /100 | #89 | Exceptional 95.7% |
| South Africans | 98.8 /100 | #90 | Exceptional 95.6% |
| Creek | 98.8 /100 | #91 | Exceptional 95.6% |
| Immigrants | Saudi Arabia | 98.8 /100 | #92 | Exceptional 95.6% |
| Immigrants | Germany | 98.7 /100 | #93 | Exceptional 95.6% |
| Immigrants | Latvia | 98.7 /100 | #94 | Exceptional 95.6% |
| Americans | 98.5 /100 | #95 | Exceptional 95.6% |
| Filipinos | 98.5 /100 | #96 | Exceptional 95.6% |
| Delaware | 98.4 /100 | #97 | Exceptional 95.6% |
| Immigrants | Japan | 98.4 /100 | #98 | Exceptional 95.6% |
| Menominee | 98.3 /100 | #99 | Exceptional 95.6% |