Guyanese vs Immigrants from Portugal 1st Grade
COMPARE
Guyanese
Immigrants from Portugal
1st Grade
1st Grade Comparison
Guyanese
Immigrants from Portugal
96.9%
1ST GRADE
0.0/ 100
METRIC RATING
313th/ 347
METRIC RANK
97.3%
1ST GRADE
0.0/ 100
METRIC RATING
285th/ 347
METRIC RANK
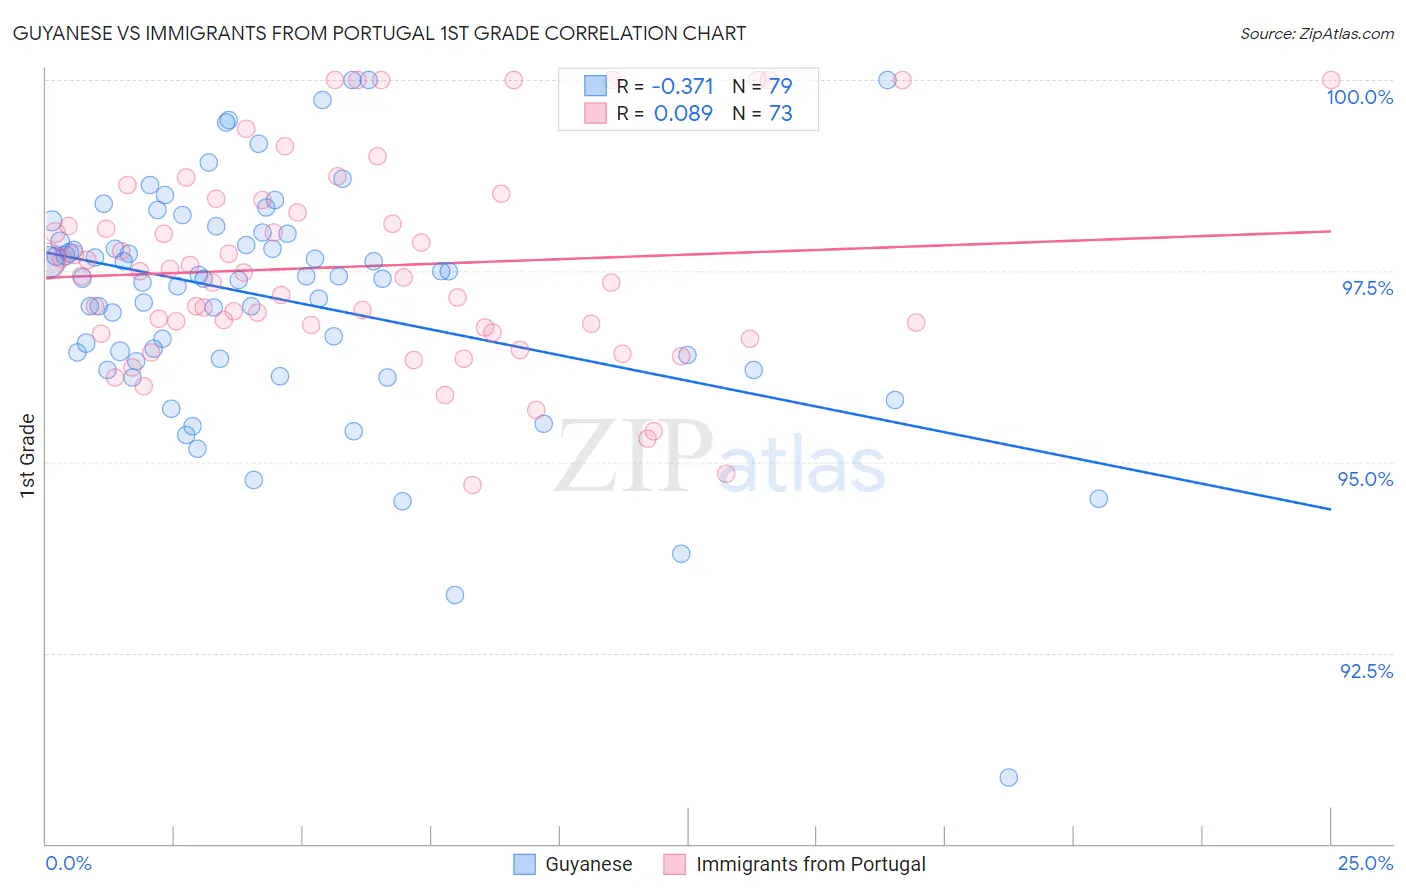
Guyanese vs Immigrants from Portugal 1st Grade Correlation Chart
The statistical analysis conducted on geographies consisting of 176,921,765 people shows a mild negative correlation between the proportion of Guyanese and percentage of population with at least 1st grade education in the United States with a correlation coefficient (R) of -0.371 and weighted average of 96.9%. Similarly, the statistical analysis conducted on geographies consisting of 174,792,107 people shows a slight positive correlation between the proportion of Immigrants from Portugal and percentage of population with at least 1st grade education in the United States with a correlation coefficient (R) of 0.089 and weighted average of 97.3%, a difference of 0.42%.
1st Grade Correlation Summary
| Measurement | Guyanese | Immigrants from Portugal |
| Minimum | 90.9% | 94.7% |
| Maximum | 100.0% | 100.0% |
| Range | 9.1% | 5.3% |
| Mean | 97.1% | 97.6% |
| Median | 97.4% | 97.4% |
| Interquartile 25% (IQ1) | 96.4% | 96.7% |
| Interquartile 75% (IQ3) | 98.0% | 98.3% |
| Interquartile Range (IQR) | 1.6% | 1.6% |
| Standard Deviation (Sample) | 1.5% | 1.3% |
| Standard Deviation (Population) | 1.5% | 1.3% |
Similar Demographics by 1st Grade
Demographics Similar to Guyanese by 1st Grade
In terms of 1st grade, the demographic groups most similar to Guyanese are Sri Lankan (96.9%, a difference of 0.010%), Cape Verdean (96.9%, a difference of 0.010%), Honduran (96.9%, a difference of 0.020%), Immigrants from Haiti (96.9%, a difference of 0.030%), and Immigrants from the Azores (96.9%, a difference of 0.030%).
| Demographics | Rating | Rank | 1st Grade |
| Belizeans | 0.0 /100 | #306 | Tragic 96.9% |
| Immigrants | Somalia | 0.0 /100 | #307 | Tragic 96.9% |
| Hispanics or Latinos | 0.0 /100 | #308 | Tragic 96.9% |
| Immigrants | Haiti | 0.0 /100 | #309 | Tragic 96.9% |
| Immigrants | Azores | 0.0 /100 | #310 | Tragic 96.9% |
| Sri Lankans | 0.0 /100 | #311 | Tragic 96.9% |
| Cape Verdeans | 0.0 /100 | #312 | Tragic 96.9% |
| Guyanese | 0.0 /100 | #313 | Tragic 96.9% |
| Hondurans | 0.0 /100 | #314 | Tragic 96.9% |
| Immigrants | Belize | 0.0 /100 | #315 | Tragic 96.9% |
| Immigrants | Ecuador | 0.0 /100 | #316 | Tragic 96.9% |
| Immigrants | Nicaragua | 0.0 /100 | #317 | Tragic 96.9% |
| Immigrants | Laos | 0.0 /100 | #318 | Tragic 96.8% |
| Immigrants | Guyana | 0.0 /100 | #319 | Tragic 96.8% |
| Immigrants | Burma/Myanmar | 0.0 /100 | #320 | Tragic 96.8% |
Demographics Similar to Immigrants from Portugal by 1st Grade
In terms of 1st grade, the demographic groups most similar to Immigrants from Portugal are Immigrants from Trinidad and Tobago (97.3%, a difference of 0.0%), Immigrants from West Indies (97.3%, a difference of 0.010%), Immigrants from Barbados (97.3%, a difference of 0.010%), Immigrants from Hong Kong (97.3%, a difference of 0.030%), and Immigrants from Thailand (97.3%, a difference of 0.030%).
| Demographics | Rating | Rank | 1st Grade |
| Immigrants | Uzbekistan | 0.1 /100 | #278 | Tragic 97.4% |
| Immigrants | Ghana | 0.1 /100 | #279 | Tragic 97.4% |
| Afghans | 0.1 /100 | #280 | Tragic 97.4% |
| Trinidadians and Tobagonians | 0.1 /100 | #281 | Tragic 97.3% |
| Barbadians | 0.1 /100 | #282 | Tragic 97.3% |
| Immigrants | West Indies | 0.0 /100 | #283 | Tragic 97.3% |
| Immigrants | Trinidad and Tobago | 0.0 /100 | #284 | Tragic 97.3% |
| Immigrants | Portugal | 0.0 /100 | #285 | Tragic 97.3% |
| Immigrants | Barbados | 0.0 /100 | #286 | Tragic 97.3% |
| Immigrants | Hong Kong | 0.0 /100 | #287 | Tragic 97.3% |
| Immigrants | Thailand | 0.0 /100 | #288 | Tragic 97.3% |
| Immigrants | Afghanistan | 0.0 /100 | #289 | Tragic 97.3% |
| Immigrants | St. Vincent and the Grenadines | 0.0 /100 | #290 | Tragic 97.3% |
| Houma | 0.0 /100 | #291 | Tragic 97.2% |
| British West Indians | 0.0 /100 | #292 | Tragic 97.2% |