Afghan vs Pennsylvania German 9th Grade
COMPARE
Afghan
Pennsylvania German
9th Grade
9th Grade Comparison
Afghans
Pennsylvania Germans
94.2%
9TH GRADE
1.8/ 100
METRIC RATING
247th/ 347
METRIC RANK
93.3%
9TH GRADE
0.0/ 100
METRIC RATING
290th/ 347
METRIC RANK
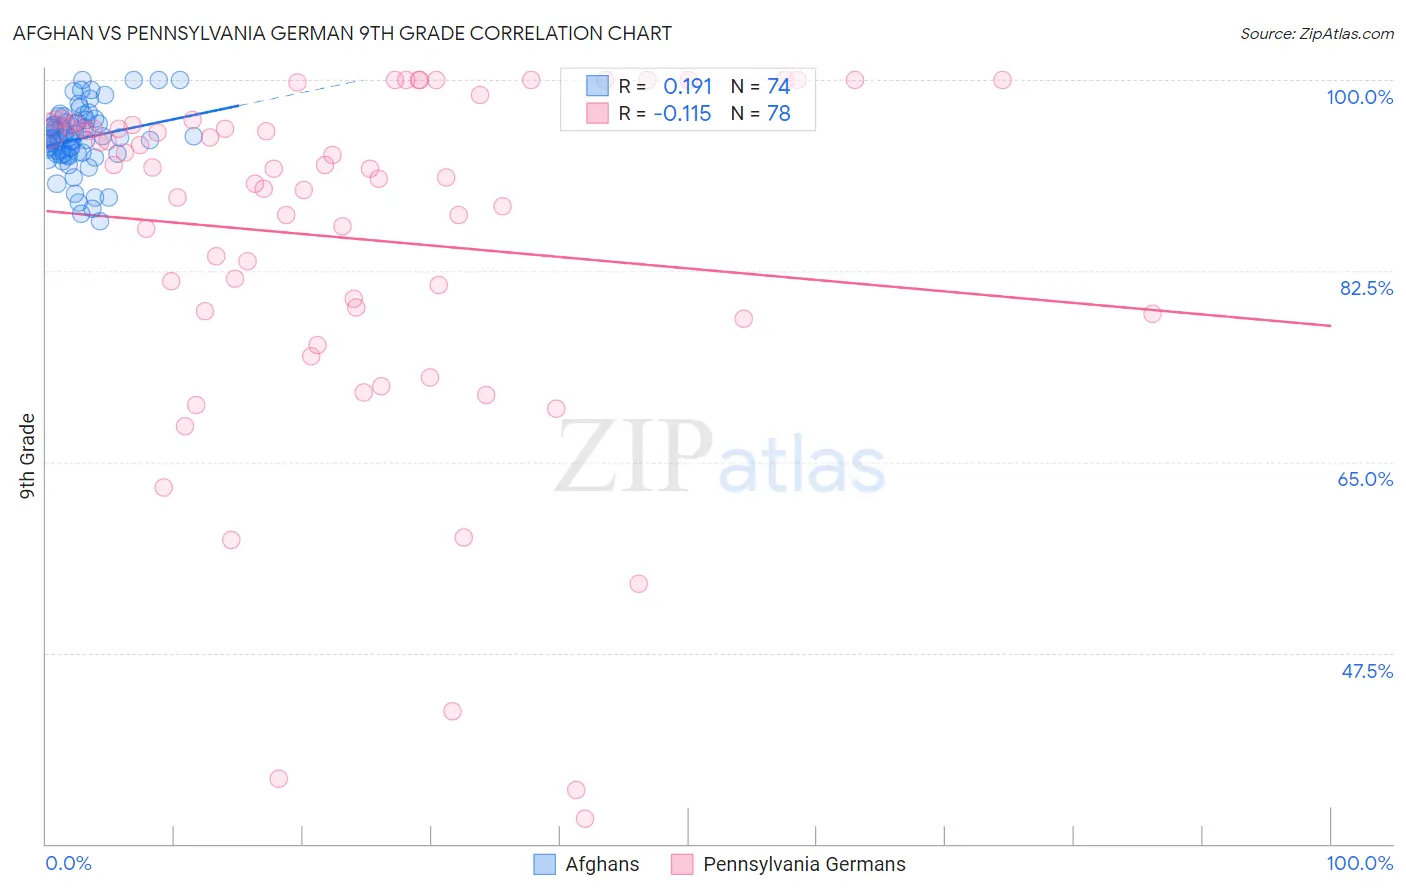
Afghan vs Pennsylvania German 9th Grade Correlation Chart
The statistical analysis conducted on geographies consisting of 148,851,685 people shows a poor positive correlation between the proportion of Afghans and percentage of population with at least 9th grade education in the United States with a correlation coefficient (R) of 0.191 and weighted average of 94.2%. Similarly, the statistical analysis conducted on geographies consisting of 234,103,120 people shows a poor negative correlation between the proportion of Pennsylvania Germans and percentage of population with at least 9th grade education in the United States with a correlation coefficient (R) of -0.115 and weighted average of 93.3%, a difference of 0.97%.
9th Grade Correlation Summary
| Measurement | Afghan | Pennsylvania German |
| Minimum | 87.1% | 32.3% |
| Maximum | 100.0% | 100.0% |
| Range | 12.9% | 67.7% |
| Mean | 94.6% | 85.5% |
| Median | 94.6% | 91.9% |
| Interquartile 25% (IQ1) | 93.2% | 78.8% |
| Interquartile 75% (IQ3) | 96.1% | 95.8% |
| Interquartile Range (IQR) | 2.9% | 17.0% |
| Standard Deviation (Sample) | 2.9% | 16.2% |
| Standard Deviation (Population) | 2.9% | 16.1% |
Similar Demographics by 9th Grade
Demographics Similar to Afghans by 9th Grade
In terms of 9th grade, the demographic groups most similar to Afghans are Paiute (94.2%, a difference of 0.010%), Senegalese (94.2%, a difference of 0.010%), Dutch West Indian (94.2%, a difference of 0.020%), Immigrants from Middle Africa (94.2%, a difference of 0.030%), and Immigrants from Cameroon (94.2%, a difference of 0.030%).
| Demographics | Rating | Rank | 9th Grade |
| Immigrants | Ethiopia | 2.7 /100 | #240 | Tragic 94.3% |
| Spanish Americans | 2.6 /100 | #241 | Tragic 94.2% |
| Immigrants | Middle Africa | 2.2 /100 | #242 | Tragic 94.2% |
| Immigrants | Cameroon | 2.1 /100 | #243 | Tragic 94.2% |
| Dutch West Indians | 2.0 /100 | #244 | Tragic 94.2% |
| Paiute | 1.9 /100 | #245 | Tragic 94.2% |
| Senegalese | 1.9 /100 | #246 | Tragic 94.2% |
| Afghans | 1.8 /100 | #247 | Tragic 94.2% |
| Immigrants | Somalia | 1.4 /100 | #248 | Tragic 94.1% |
| Uruguayans | 1.3 /100 | #249 | Tragic 94.1% |
| Immigrants | Hong Kong | 1.3 /100 | #250 | Tragic 94.1% |
| Jamaicans | 1.0 /100 | #251 | Tragic 94.1% |
| Immigrants | Senegal | 0.9 /100 | #252 | Tragic 94.1% |
| Colombians | 0.8 /100 | #253 | Tragic 94.0% |
| U.S. Virgin Islanders | 0.7 /100 | #254 | Tragic 94.0% |
Demographics Similar to Pennsylvania Germans by 9th Grade
In terms of 9th grade, the demographic groups most similar to Pennsylvania Germans are Immigrants from West Indies (93.3%, a difference of 0.0%), Immigrants from South Eastern Asia (93.3%, a difference of 0.070%), British West Indian (93.2%, a difference of 0.080%), Immigrants from Barbados (93.4%, a difference of 0.10%), and Immigrants from St. Vincent and the Grenadines (93.4%, a difference of 0.10%).
| Demographics | Rating | Rank | 9th Grade |
| Barbadians | 0.0 /100 | #283 | Tragic 93.5% |
| Bangladeshis | 0.0 /100 | #284 | Tragic 93.4% |
| Immigrants | Peru | 0.0 /100 | #285 | Tragic 93.4% |
| Immigrants | Barbados | 0.0 /100 | #286 | Tragic 93.4% |
| Immigrants | St. Vincent and the Grenadines | 0.0 /100 | #287 | Tragic 93.4% |
| Immigrants | South Eastern Asia | 0.0 /100 | #288 | Tragic 93.3% |
| Immigrants | West Indies | 0.0 /100 | #289 | Tragic 93.3% |
| Pennsylvania Germans | 0.0 /100 | #290 | Tragic 93.3% |
| British West Indians | 0.0 /100 | #291 | Tragic 93.2% |
| Immigrants | Laos | 0.0 /100 | #292 | Tragic 93.2% |
| Sri Lankans | 0.0 /100 | #293 | Tragic 93.2% |
| Cubans | 0.0 /100 | #294 | Tragic 93.2% |
| Immigrants | Burma/Myanmar | 0.0 /100 | #295 | Tragic 93.1% |
| Indonesians | 0.0 /100 | #296 | Tragic 93.1% |
| Fijians | 0.0 /100 | #297 | Tragic 93.1% |