Hopi vs Comanche 9th Grade
COMPARE
Hopi
Comanche
9th Grade
9th Grade Comparison
Hopi
Comanche
94.8%
9TH GRADE
37.1/ 100
METRIC RATING
186th/ 347
METRIC RANK
94.6%
9TH GRADE
14.9/ 100
METRIC RATING
209th/ 347
METRIC RANK
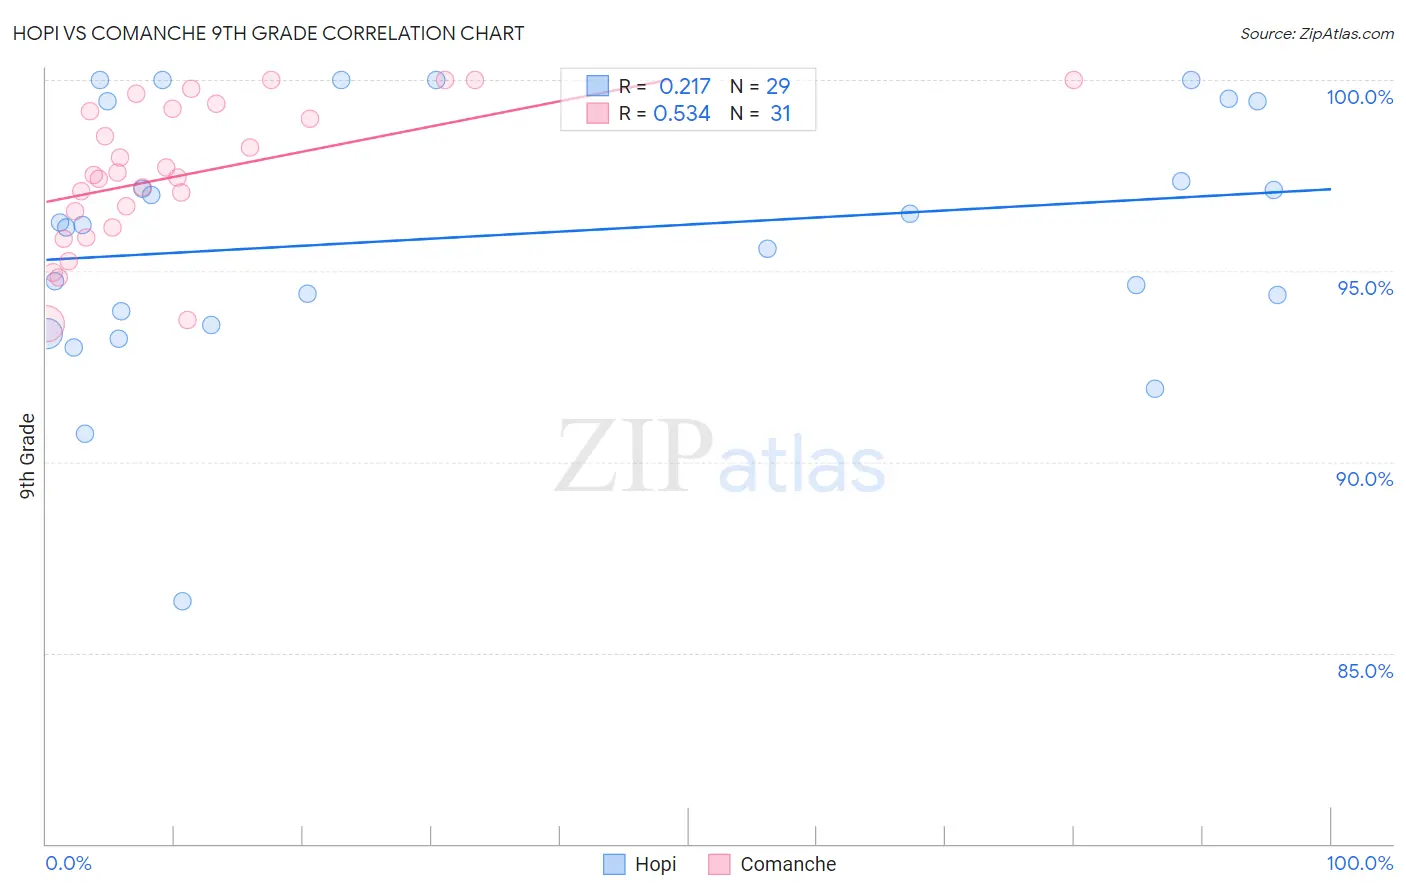
Hopi vs Comanche 9th Grade Correlation Chart
The statistical analysis conducted on geographies consisting of 74,739,957 people shows a weak positive correlation between the proportion of Hopi and percentage of population with at least 9th grade education in the United States with a correlation coefficient (R) of 0.217 and weighted average of 94.8%. Similarly, the statistical analysis conducted on geographies consisting of 109,786,530 people shows a substantial positive correlation between the proportion of Comanche and percentage of population with at least 9th grade education in the United States with a correlation coefficient (R) of 0.534 and weighted average of 94.6%, a difference of 0.22%.
9th Grade Correlation Summary
| Measurement | Hopi | Comanche |
| Minimum | 86.4% | 93.6% |
| Maximum | 100.0% | 100.0% |
| Range | 13.6% | 6.4% |
| Mean | 95.9% | 97.5% |
| Median | 96.2% | 97.5% |
| Interquartile 25% (IQ1) | 93.8% | 96.1% |
| Interquartile 75% (IQ3) | 99.4% | 99.2% |
| Interquartile Range (IQR) | 5.7% | 3.1% |
| Standard Deviation (Sample) | 3.3% | 1.9% |
| Standard Deviation (Population) | 3.2% | 1.8% |
Similar Demographics by 9th Grade
Demographics Similar to Hopi by 9th Grade
In terms of 9th grade, the demographic groups most similar to Hopi are Argentinean (94.8%, a difference of 0.0%), Liberian (94.8%, a difference of 0.0%), Guamanian/Chamorro (94.8%, a difference of 0.010%), Immigrants from Nepal (94.8%, a difference of 0.020%), and Immigrants from Albania (94.8%, a difference of 0.020%).
| Demographics | Rating | Rank | 9th Grade |
| Immigrants | Venezuela | 46.5 /100 | #179 | Average 94.9% |
| Immigrants | Uganda | 43.1 /100 | #180 | Average 94.8% |
| Sierra Leoneans | 42.7 /100 | #181 | Average 94.8% |
| Seminole | 42.5 /100 | #182 | Average 94.8% |
| Immigrants | Nepal | 39.7 /100 | #183 | Fair 94.8% |
| Argentineans | 37.6 /100 | #184 | Fair 94.8% |
| Liberians | 37.4 /100 | #185 | Fair 94.8% |
| Hopi | 37.1 /100 | #186 | Fair 94.8% |
| Guamanians/Chamorros | 35.5 /100 | #187 | Fair 94.8% |
| Immigrants | Albania | 34.5 /100 | #188 | Fair 94.8% |
| Immigrants | Argentina | 34.4 /100 | #189 | Fair 94.8% |
| Sudanese | 32.7 /100 | #190 | Fair 94.7% |
| Assyrians/Chaldeans/Syriacs | 32.0 /100 | #191 | Fair 94.7% |
| Immigrants | Northern Africa | 30.7 /100 | #192 | Fair 94.7% |
| Paraguayans | 30.1 /100 | #193 | Fair 94.7% |
Demographics Similar to Comanche by 9th Grade
In terms of 9th grade, the demographic groups most similar to Comanche are Immigrants from Pakistan (94.6%, a difference of 0.010%), Immigrants from Morocco (94.6%, a difference of 0.020%), Immigrants from Chile (94.5%, a difference of 0.020%), Samoan (94.6%, a difference of 0.030%), and Immigrants from Sudan (94.6%, a difference of 0.040%).
| Demographics | Rating | Rank | 9th Grade |
| Immigrants | Eastern Asia | 19.8 /100 | #202 | Poor 94.6% |
| Immigrants | Bahamas | 19.8 /100 | #203 | Poor 94.6% |
| Moroccans | 19.6 /100 | #204 | Poor 94.6% |
| Immigrants | Sudan | 17.6 /100 | #205 | Poor 94.6% |
| Samoans | 17.3 /100 | #206 | Poor 94.6% |
| Immigrants | Morocco | 16.3 /100 | #207 | Poor 94.6% |
| Immigrants | Pakistan | 15.5 /100 | #208 | Poor 94.6% |
| Comanche | 14.9 /100 | #209 | Poor 94.6% |
| Immigrants | Chile | 13.4 /100 | #210 | Poor 94.5% |
| Immigrants | Indonesia | 12.3 /100 | #211 | Poor 94.5% |
| Immigrants | Malaysia | 12.2 /100 | #212 | Poor 94.5% |
| Immigrants | Oceania | 12.1 /100 | #213 | Poor 94.5% |
| Immigrants | Liberia | 11.8 /100 | #214 | Poor 94.5% |
| Immigrants | Syria | 11.0 /100 | #215 | Poor 94.5% |
| Immigrants | Western Asia | 10.7 /100 | #216 | Poor 94.5% |