Cambodian vs Immigrants from Congo No Schooling Completed
COMPARE
Cambodian
Immigrants from Congo
No Schooling Completed
No Schooling Completed Comparison
Cambodians
Immigrants from Congo
1.9%
NO SCHOOLING COMPLETED
93.8/ 100
METRIC RATING
124th/ 347
METRIC RANK
2.4%
NO SCHOOLING COMPLETED
1.4/ 100
METRIC RATING
246th/ 347
METRIC RANK
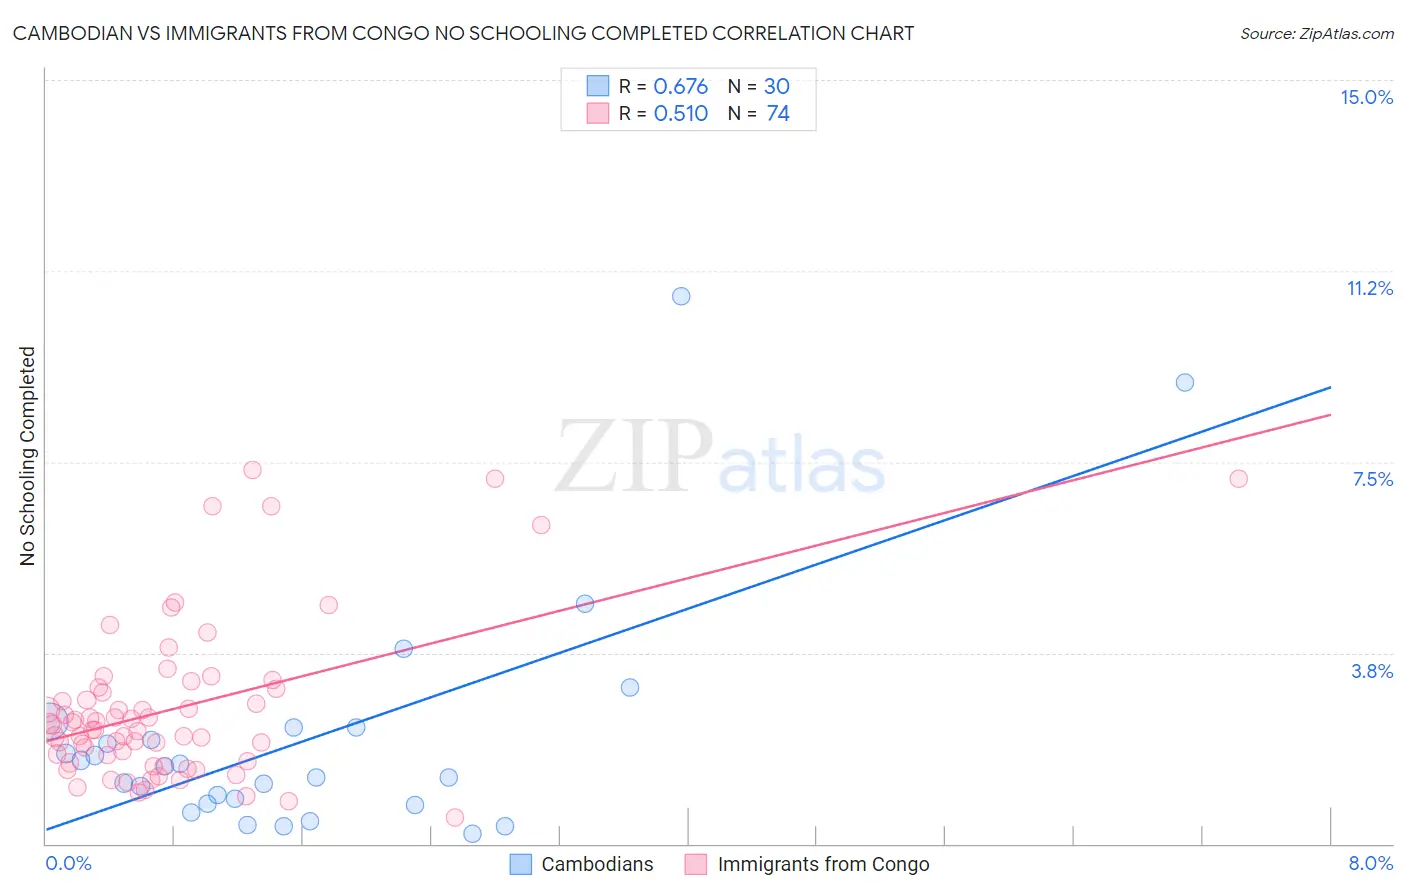
Cambodian vs Immigrants from Congo No Schooling Completed Correlation Chart
The statistical analysis conducted on geographies consisting of 102,234,133 people shows a significant positive correlation between the proportion of Cambodians and percentage of population with no schooling in the United States with a correlation coefficient (R) of 0.676 and weighted average of 1.9%. Similarly, the statistical analysis conducted on geographies consisting of 91,959,096 people shows a substantial positive correlation between the proportion of Immigrants from Congo and percentage of population with no schooling in the United States with a correlation coefficient (R) of 0.510 and weighted average of 2.4%, a difference of 25.8%.
No Schooling Completed Correlation Summary
| Measurement | Cambodian | Immigrants from Congo |
| Minimum | 0.20% | 0.52% |
| Maximum | 10.7% | 7.4% |
| Range | 10.5% | 6.8% |
| Mean | 2.1% | 2.7% |
| Median | 1.4% | 2.3% |
| Interquartile 25% (IQ1) | 0.79% | 1.6% |
| Interquartile 75% (IQ3) | 2.3% | 3.0% |
| Interquartile Range (IQR) | 1.5% | 1.4% |
| Standard Deviation (Sample) | 2.4% | 1.6% |
| Standard Deviation (Population) | 2.3% | 1.5% |
Similar Demographics by No Schooling Completed
Demographics Similar to Cambodians by No Schooling Completed
In terms of no schooling completed, the demographic groups most similar to Cambodians are Immigrants from Kuwait (1.9%, a difference of 0.080%), Immigrants from Europe (1.9%, a difference of 0.090%), Cree (1.9%, a difference of 0.44%), Immigrants from Croatia (1.9%, a difference of 0.47%), and Immigrants from Bulgaria (1.9%, a difference of 0.53%).
| Demographics | Rating | Rank | No Schooling Completed |
| Immigrants | Serbia | 95.8 /100 | #117 | Exceptional 1.9% |
| Spanish | 95.5 /100 | #118 | Exceptional 1.9% |
| Iroquois | 95.1 /100 | #119 | Exceptional 1.9% |
| Immigrants | Bulgaria | 94.6 /100 | #120 | Exceptional 1.9% |
| Immigrants | Croatia | 94.5 /100 | #121 | Exceptional 1.9% |
| Cree | 94.5 /100 | #122 | Exceptional 1.9% |
| Immigrants | Kuwait | 93.9 /100 | #123 | Exceptional 1.9% |
| Cambodians | 93.8 /100 | #124 | Exceptional 1.9% |
| Immigrants | Europe | 93.7 /100 | #125 | Exceptional 1.9% |
| Immigrants | Romania | 92.6 /100 | #126 | Exceptional 1.9% |
| Israelis | 92.4 /100 | #127 | Exceptional 1.9% |
| Spaniards | 92.3 /100 | #128 | Exceptional 1.9% |
| Seminole | 92.0 /100 | #129 | Exceptional 1.9% |
| Palestinians | 91.8 /100 | #130 | Exceptional 1.9% |
| Immigrants | Hungary | 91.6 /100 | #131 | Exceptional 1.9% |
Demographics Similar to Immigrants from Congo by No Schooling Completed
In terms of no schooling completed, the demographic groups most similar to Immigrants from Congo are Peruvian (2.4%, a difference of 0.050%), Bolivian (2.4%, a difference of 0.050%), Immigrants from Iraq (2.4%, a difference of 0.11%), South American (2.4%, a difference of 0.16%), and Immigrants from Indonesia (2.4%, a difference of 0.20%).
| Demographics | Rating | Rank | No Schooling Completed |
| Liberians | 1.8 /100 | #239 | Tragic 2.4% |
| Immigrants | Senegal | 1.7 /100 | #240 | Tragic 2.4% |
| Koreans | 1.7 /100 | #241 | Tragic 2.4% |
| Immigrants | Indonesia | 1.5 /100 | #242 | Tragic 2.4% |
| South Americans | 1.5 /100 | #243 | Tragic 2.4% |
| Peruvians | 1.4 /100 | #244 | Tragic 2.4% |
| Bolivians | 1.4 /100 | #245 | Tragic 2.4% |
| Immigrants | Congo | 1.4 /100 | #246 | Tragic 2.4% |
| Immigrants | Iraq | 1.3 /100 | #247 | Tragic 2.4% |
| Asians | 1.2 /100 | #248 | Tragic 2.4% |
| Jamaicans | 1.2 /100 | #249 | Tragic 2.4% |
| Immigrants | Middle Africa | 1.1 /100 | #250 | Tragic 2.4% |
| Immigrants | Africa | 1.1 /100 | #251 | Tragic 2.4% |
| Immigrants | Colombia | 1.0 /100 | #252 | Tragic 2.4% |
| Immigrants | Asia | 0.9 /100 | #253 | Tragic 2.4% |