Croatian vs Immigrants from Morocco Master's Degree
COMPARE
Croatian
Immigrants from Morocco
Master's Degree
Master's Degree Comparison
Croatians
Immigrants from Morocco
16.4%
MASTER'S DEGREE
95.6/ 100
METRIC RATING
123rd/ 347
METRIC RANK
17.1%
MASTER'S DEGREE
98.9/ 100
METRIC RATING
95th/ 347
METRIC RANK
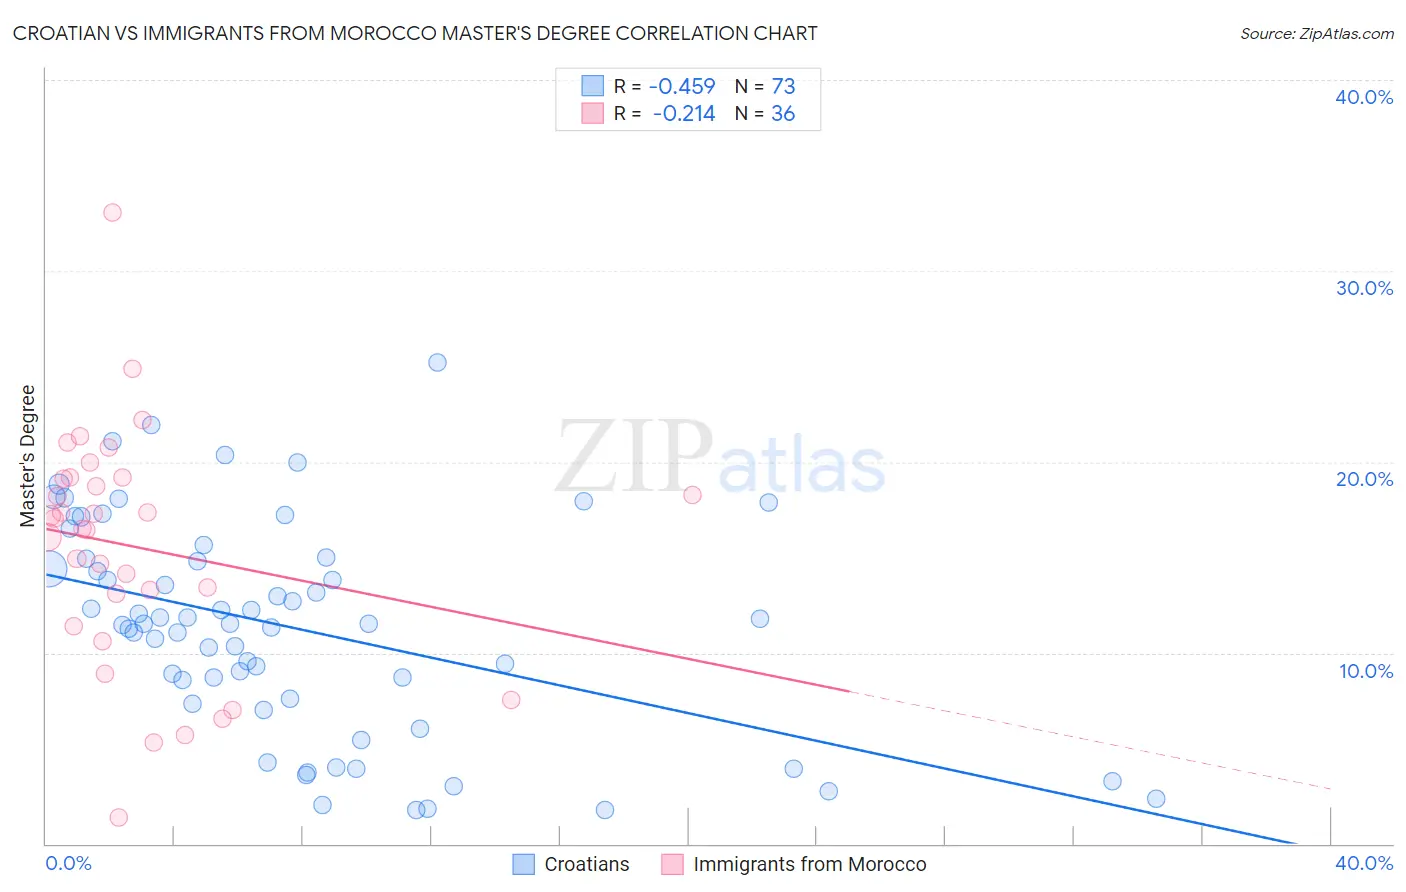
Croatian vs Immigrants from Morocco Master's Degree Correlation Chart
The statistical analysis conducted on geographies consisting of 375,633,204 people shows a moderate negative correlation between the proportion of Croatians and percentage of population with at least master's degree education in the United States with a correlation coefficient (R) of -0.459 and weighted average of 16.4%. Similarly, the statistical analysis conducted on geographies consisting of 178,911,392 people shows a weak negative correlation between the proportion of Immigrants from Morocco and percentage of population with at least master's degree education in the United States with a correlation coefficient (R) of -0.214 and weighted average of 17.1%, a difference of 4.2%.
Master's Degree Correlation Summary
| Measurement | Croatian | Immigrants from Morocco |
| Minimum | 1.8% | 1.4% |
| Maximum | 25.2% | 33.1% |
| Range | 23.5% | 31.7% |
| Mean | 11.3% | 15.5% |
| Median | 11.5% | 16.8% |
| Interquartile 25% (IQ1) | 7.5% | 12.2% |
| Interquartile 75% (IQ3) | 15.0% | 19.1% |
| Interquartile Range (IQR) | 7.5% | 6.9% |
| Standard Deviation (Sample) | 5.6% | 6.2% |
| Standard Deviation (Population) | 5.5% | 6.1% |
Similar Demographics by Master's Degree
Demographics Similar to Croatians by Master's Degree
In terms of master's degree, the demographic groups most similar to Croatians are British (16.4%, a difference of 0.010%), Immigrants from Eritrea (16.4%, a difference of 0.070%), Italian (16.4%, a difference of 0.14%), Immigrants from Eastern Africa (16.3%, a difference of 0.26%), and Afghan (16.5%, a difference of 0.44%).
| Demographics | Rating | Rank | Master's Degree |
| Immigrants | Southern Europe | 97.2 /100 | #116 | Exceptional 16.6% |
| Immigrants | Moldova | 97.2 /100 | #117 | Exceptional 16.6% |
| Brazilians | 96.8 /100 | #118 | Exceptional 16.5% |
| Jordanians | 96.5 /100 | #119 | Exceptional 16.5% |
| Lebanese | 96.4 /100 | #120 | Exceptional 16.5% |
| Afghans | 96.2 /100 | #121 | Exceptional 16.5% |
| British | 95.6 /100 | #122 | Exceptional 16.4% |
| Croatians | 95.6 /100 | #123 | Exceptional 16.4% |
| Immigrants | Eritrea | 95.5 /100 | #124 | Exceptional 16.4% |
| Italians | 95.4 /100 | #125 | Exceptional 16.4% |
| Immigrants | Eastern Africa | 95.2 /100 | #126 | Exceptional 16.3% |
| Palestinians | 94.8 /100 | #127 | Exceptional 16.3% |
| Immigrants | Sierra Leone | 94.7 /100 | #128 | Exceptional 16.3% |
| Immigrants | Syria | 93.3 /100 | #129 | Exceptional 16.2% |
| Immigrants | Jordan | 92.7 /100 | #130 | Exceptional 16.1% |
Demographics Similar to Immigrants from Morocco by Master's Degree
In terms of master's degree, the demographic groups most similar to Immigrants from Morocco are Immigrants from Northern Africa (17.1%, a difference of 0.030%), Immigrants from England (17.0%, a difference of 0.19%), Immigrants from Ukraine (17.0%, a difference of 0.29%), Ugandan (17.1%, a difference of 0.32%), and Laotian (17.0%, a difference of 0.35%).
| Demographics | Rating | Rank | Master's Degree |
| Immigrants | Canada | 99.2 /100 | #88 | Exceptional 17.2% |
| Bhutanese | 99.1 /100 | #89 | Exceptional 17.2% |
| Immigrants | Egypt | 99.1 /100 | #90 | Exceptional 17.2% |
| Romanians | 99.1 /100 | #91 | Exceptional 17.2% |
| Immigrants | North America | 99.1 /100 | #92 | Exceptional 17.2% |
| Immigrants | Italy | 99.1 /100 | #93 | Exceptional 17.2% |
| Ugandans | 99.0 /100 | #94 | Exceptional 17.1% |
| Immigrants | Morocco | 98.9 /100 | #95 | Exceptional 17.1% |
| Immigrants | Northern Africa | 98.9 /100 | #96 | Exceptional 17.1% |
| Immigrants | England | 98.8 /100 | #97 | Exceptional 17.0% |
| Immigrants | Ukraine | 98.8 /100 | #98 | Exceptional 17.0% |
| Laotians | 98.8 /100 | #99 | Exceptional 17.0% |
| Albanians | 98.7 /100 | #100 | Exceptional 17.0% |
| Immigrants | Nepal | 98.6 /100 | #101 | Exceptional 17.0% |
| Chileans | 98.6 /100 | #102 | Exceptional 16.9% |