New Zealander vs Immigrants from Cuba Professional Degree
COMPARE
New Zealander
Immigrants from Cuba
Professional Degree
Professional Degree Comparison
New Zealanders
Immigrants from Cuba
6.0%
PROFESSIONAL DEGREE
100.0/ 100
METRIC RATING
41st/ 347
METRIC RANK
3.6%
PROFESSIONAL DEGREE
0.6/ 100
METRIC RATING
269th/ 347
METRIC RANK
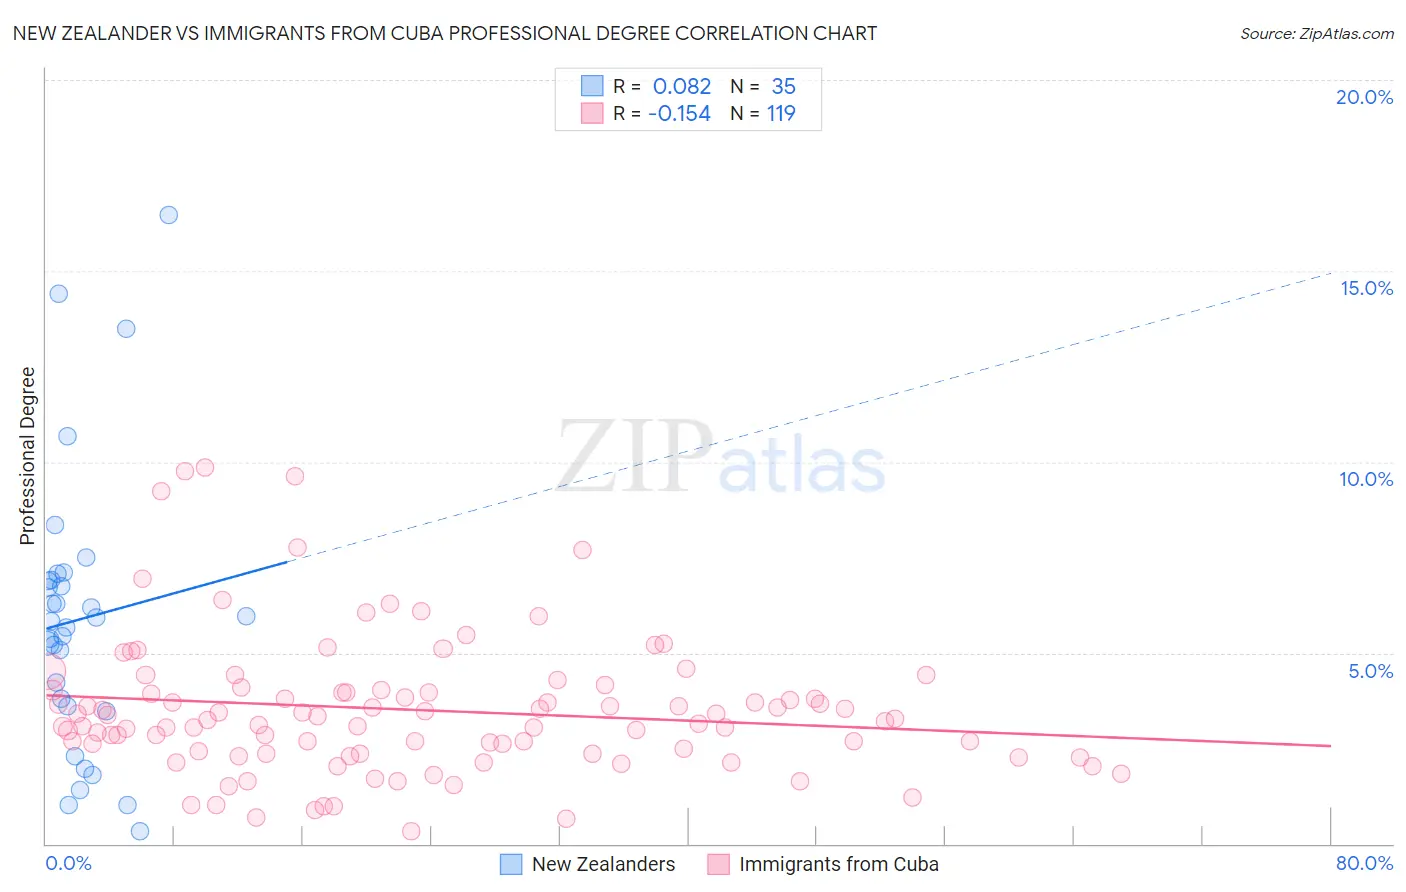
New Zealander vs Immigrants from Cuba Professional Degree Correlation Chart
The statistical analysis conducted on geographies consisting of 106,863,101 people shows a slight positive correlation between the proportion of New Zealanders and percentage of population with at least professional degree education in the United States with a correlation coefficient (R) of 0.082 and weighted average of 6.0%. Similarly, the statistical analysis conducted on geographies consisting of 325,367,242 people shows a poor negative correlation between the proportion of Immigrants from Cuba and percentage of population with at least professional degree education in the United States with a correlation coefficient (R) of -0.154 and weighted average of 3.6%, a difference of 65.6%.
Professional Degree Correlation Summary
| Measurement | New Zealander | Immigrants from Cuba |
| Minimum | 0.31% | 0.31% |
| Maximum | 16.5% | 9.9% |
| Range | 16.1% | 9.6% |
| Mean | 5.9% | 3.5% |
| Median | 5.8% | 3.2% |
| Interquartile 25% (IQ1) | 3.6% | 2.4% |
| Interquartile 75% (IQ3) | 6.9% | 4.0% |
| Interquartile Range (IQR) | 3.3% | 1.6% |
| Standard Deviation (Sample) | 3.6% | 1.8% |
| Standard Deviation (Population) | 3.6% | 1.8% |
Similar Demographics by Professional Degree
Demographics Similar to New Zealanders by Professional Degree
In terms of professional degree, the demographic groups most similar to New Zealanders are Estonian (6.0%, a difference of 0.010%), Cambodian (6.0%, a difference of 0.18%), Immigrants from Saudi Arabia (5.9%, a difference of 0.33%), Argentinean (5.9%, a difference of 0.49%), and Immigrants from South Africa (6.0%, a difference of 0.66%).
| Demographics | Rating | Rank | Professional Degree |
| Mongolians | 100.0 /100 | #34 | Exceptional 6.1% |
| Immigrants | Korea | 100.0 /100 | #35 | Exceptional 6.1% |
| Immigrants | Russia | 100.0 /100 | #36 | Exceptional 6.0% |
| Immigrants | Austria | 100.0 /100 | #37 | Exceptional 6.0% |
| Immigrants | Norway | 100.0 /100 | #38 | Exceptional 6.0% |
| Immigrants | South Africa | 100.0 /100 | #39 | Exceptional 6.0% |
| Cambodians | 100.0 /100 | #40 | Exceptional 6.0% |
| New Zealanders | 100.0 /100 | #41 | Exceptional 6.0% |
| Estonians | 100.0 /100 | #42 | Exceptional 6.0% |
| Immigrants | Saudi Arabia | 100.0 /100 | #43 | Exceptional 5.9% |
| Argentineans | 100.0 /100 | #44 | Exceptional 5.9% |
| Immigrants | South Central Asia | 100.0 /100 | #45 | Exceptional 5.9% |
| Immigrants | Argentina | 100.0 /100 | #46 | Exceptional 5.9% |
| Australians | 100.0 /100 | #47 | Exceptional 5.9% |
| Paraguayans | 100.0 /100 | #48 | Exceptional 5.9% |
Demographics Similar to Immigrants from Cuba by Professional Degree
In terms of professional degree, the demographic groups most similar to Immigrants from Cuba are Central American (3.6%, a difference of 0.29%), Aleut (3.6%, a difference of 0.60%), Delaware (3.6%, a difference of 0.75%), Belizean (3.6%, a difference of 0.76%), and Immigrants from Jamaica (3.6%, a difference of 0.78%).
| Demographics | Rating | Rank | Professional Degree |
| U.S. Virgin Islanders | 1.0 /100 | #262 | Tragic 3.7% |
| Hopi | 0.9 /100 | #263 | Tragic 3.6% |
| Immigrants | Cambodia | 0.9 /100 | #264 | Tragic 3.6% |
| Immigrants | Congo | 0.8 /100 | #265 | Tragic 3.6% |
| Central American Indians | 0.8 /100 | #266 | Tragic 3.6% |
| Delaware | 0.7 /100 | #267 | Tragic 3.6% |
| Aleuts | 0.7 /100 | #268 | Tragic 3.6% |
| Immigrants | Cuba | 0.6 /100 | #269 | Tragic 3.6% |
| Central Americans | 0.6 /100 | #270 | Tragic 3.6% |
| Belizeans | 0.5 /100 | #271 | Tragic 3.6% |
| Immigrants | Jamaica | 0.5 /100 | #272 | Tragic 3.6% |
| Americans | 0.5 /100 | #273 | Tragic 3.6% |
| Potawatomi | 0.5 /100 | #274 | Tragic 3.6% |
| Immigrants | Dominica | 0.5 /100 | #275 | Tragic 3.6% |
| Liberians | 0.5 /100 | #276 | Tragic 3.6% |