Hmong vs Cape Verdean 12th Grade, No Diploma
COMPARE
Hmong
Cape Verdean
12th Grade, No Diploma
12th Grade, No Diploma Comparison
Hmong
Cape Verdeans
91.3%
12TH GRADE, NO DIPLOMA
58.0/ 100
METRIC RATING
166th/ 347
METRIC RANK
87.4%
12TH GRADE, NO DIPLOMA
0.0/ 100
METRIC RATING
314th/ 347
METRIC RANK
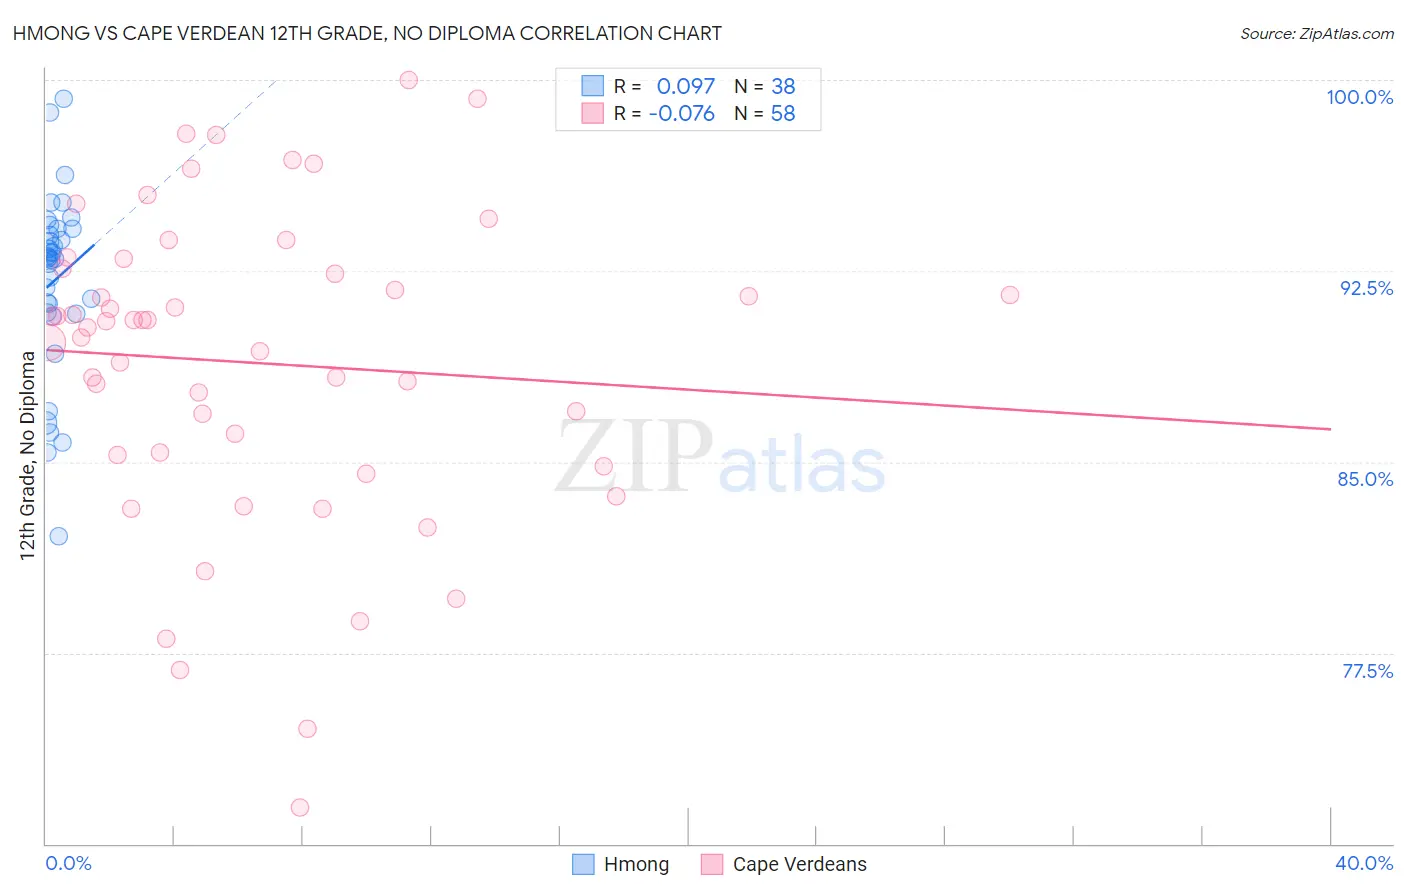
Hmong vs Cape Verdean 12th Grade, No Diploma Correlation Chart
The statistical analysis conducted on geographies consisting of 24,672,093 people shows a slight positive correlation between the proportion of Hmong and percentage of population with at least 12th grade (no diploma) education in the United States with a correlation coefficient (R) of 0.097 and weighted average of 91.3%. Similarly, the statistical analysis conducted on geographies consisting of 107,537,955 people shows a slight negative correlation between the proportion of Cape Verdeans and percentage of population with at least 12th grade (no diploma) education in the United States with a correlation coefficient (R) of -0.076 and weighted average of 87.4%, a difference of 4.4%.
12th Grade, No Diploma Correlation Summary
| Measurement | Hmong | Cape Verdean |
| Minimum | 82.1% | 71.4% |
| Maximum | 99.2% | 100.0% |
| Range | 17.1% | 28.6% |
| Mean | 92.1% | 88.9% |
| Median | 93.0% | 90.4% |
| Interquartile 25% (IQ1) | 90.9% | 85.3% |
| Interquartile 75% (IQ3) | 94.2% | 92.6% |
| Interquartile Range (IQR) | 3.3% | 7.3% |
| Standard Deviation (Sample) | 3.6% | 6.1% |
| Standard Deviation (Population) | 3.5% | 6.1% |
Similar Demographics by 12th Grade, No Diploma
Demographics Similar to Hmong by 12th Grade, No Diploma
In terms of 12th grade, no diploma, the demographic groups most similar to Hmong are Alsatian (91.3%, a difference of 0.0%), Immigrants from Malaysia (91.3%, a difference of 0.0%), Cree (91.2%, a difference of 0.010%), Immigrants from Asia (91.3%, a difference of 0.040%), and Immigrants from China (91.3%, a difference of 0.040%).
| Demographics | Rating | Rank | 12th Grade, No Diploma |
| Laotians | 64.4 /100 | #159 | Good 91.3% |
| Immigrants | Albania | 64.1 /100 | #160 | Good 91.3% |
| Immigrants | Hong Kong | 63.8 /100 | #161 | Good 91.3% |
| Brazilians | 62.0 /100 | #162 | Good 91.3% |
| Immigrants | Asia | 61.5 /100 | #163 | Good 91.3% |
| Immigrants | China | 60.9 /100 | #164 | Good 91.3% |
| Alsatians | 58.3 /100 | #165 | Average 91.3% |
| Hmong | 58.0 /100 | #166 | Average 91.3% |
| Immigrants | Malaysia | 57.8 /100 | #167 | Average 91.3% |
| Cree | 57.0 /100 | #168 | Average 91.2% |
| Immigrants | Indonesia | 54.9 /100 | #169 | Average 91.2% |
| Delaware | 52.8 /100 | #170 | Average 91.2% |
| Immigrants | Morocco | 51.4 /100 | #171 | Average 91.2% |
| Bermudans | 50.8 /100 | #172 | Average 91.2% |
| Bolivians | 50.4 /100 | #173 | Average 91.2% |
Demographics Similar to Cape Verdeans by 12th Grade, No Diploma
In terms of 12th grade, no diploma, the demographic groups most similar to Cape Verdeans are Immigrants from Caribbean (87.4%, a difference of 0.020%), Nicaraguan (87.3%, a difference of 0.040%), Apache (87.3%, a difference of 0.050%), Immigrants from Ecuador (87.5%, a difference of 0.13%), and Yaqui (87.5%, a difference of 0.14%).
| Demographics | Rating | Rank | 12th Grade, No Diploma |
| Immigrants | Portugal | 0.0 /100 | #307 | Tragic 87.6% |
| Yup'ik | 0.0 /100 | #308 | Tragic 87.6% |
| Immigrants | Armenia | 0.0 /100 | #309 | Tragic 87.6% |
| Immigrants | Cuba | 0.0 /100 | #310 | Tragic 87.5% |
| Yaqui | 0.0 /100 | #311 | Tragic 87.5% |
| Immigrants | Ecuador | 0.0 /100 | #312 | Tragic 87.5% |
| Immigrants | Caribbean | 0.0 /100 | #313 | Tragic 87.4% |
| Cape Verdeans | 0.0 /100 | #314 | Tragic 87.4% |
| Nicaraguans | 0.0 /100 | #315 | Tragic 87.3% |
| Apache | 0.0 /100 | #316 | Tragic 87.3% |
| Navajo | 0.0 /100 | #317 | Tragic 87.1% |
| Belizeans | 0.0 /100 | #318 | Tragic 87.0% |
| Immigrants | Belize | 0.0 /100 | #319 | Tragic 87.0% |
| Immigrants | Nicaragua | 0.0 /100 | #320 | Tragic 86.6% |
| Puerto Ricans | 0.0 /100 | #321 | Tragic 86.5% |