Hmong vs Cape Verdean Unemployment Among Ages 60 to 64 years
COMPARE
Hmong
Cape Verdean
Unemployment Among Ages 60 to 64 years
Unemployment Among Ages 60 to 64 years Comparison
Hmong
Cape Verdeans
4.0%
UNEMPLOYMENT AMONG AGES 60 TO 64 YEARS
100.0/ 100
METRIC RATING
4th/ 347
METRIC RANK
4.4%
UNEMPLOYMENT AMONG AGES 60 TO 64 YEARS
100.0/ 100
METRIC RATING
22nd/ 347
METRIC RANK
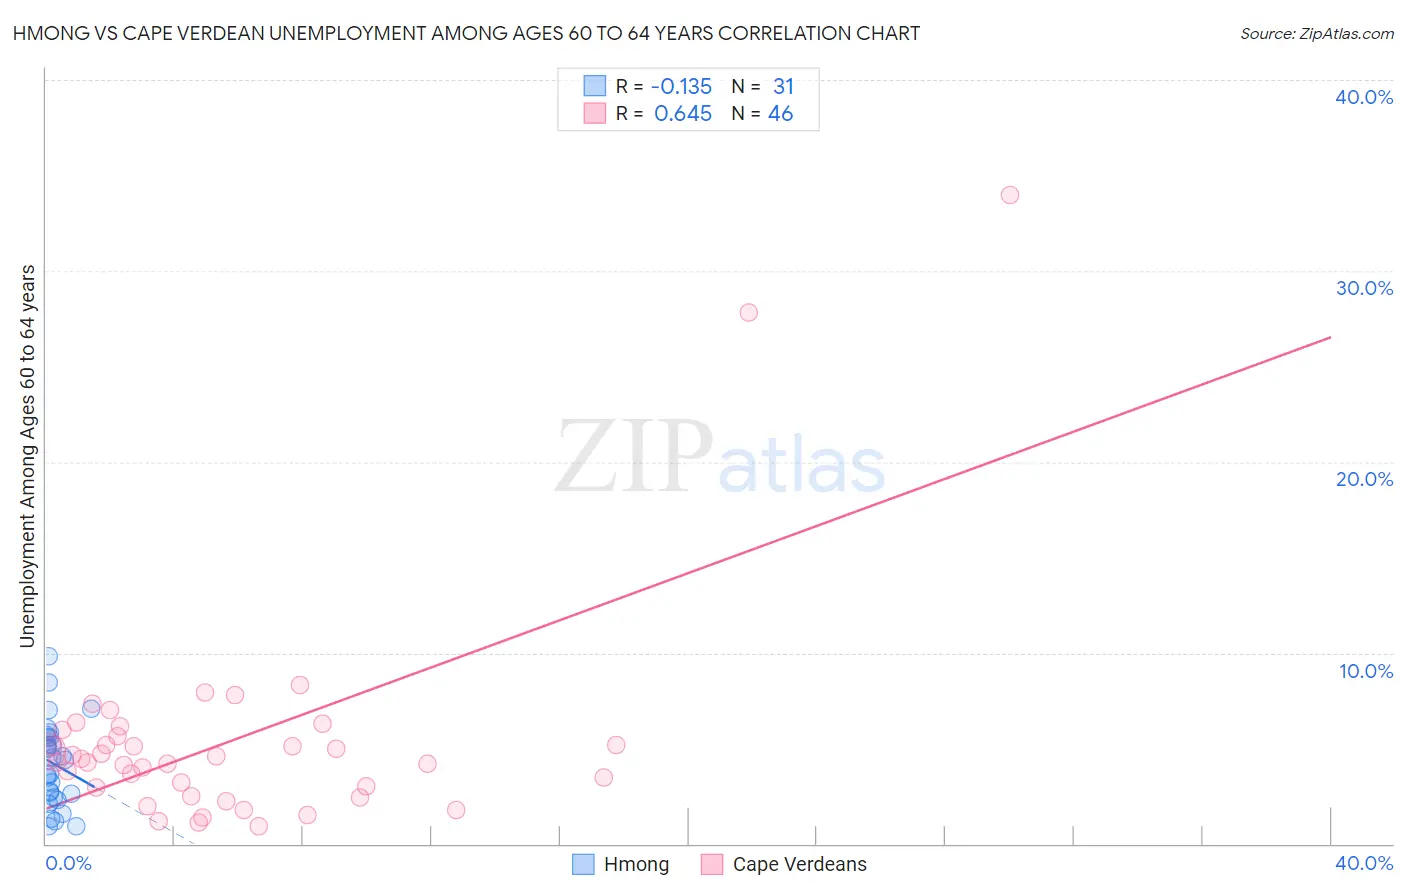
Hmong vs Cape Verdean Unemployment Among Ages 60 to 64 years Correlation Chart
The statistical analysis conducted on geographies consisting of 24,490,081 people shows a poor negative correlation between the proportion of Hmong and unemployment rate among population between the ages 60 and 64 in the United States with a correlation coefficient (R) of -0.135 and weighted average of 4.0%. Similarly, the statistical analysis conducted on geographies consisting of 104,523,117 people shows a significant positive correlation between the proportion of Cape Verdeans and unemployment rate among population between the ages 60 and 64 in the United States with a correlation coefficient (R) of 0.645 and weighted average of 4.4%, a difference of 9.5%.
Unemployment Among Ages 60 to 64 years Correlation Summary
| Measurement | Hmong | Cape Verdean |
| Minimum | 0.90% | 0.90% |
| Maximum | 9.8% | 34.0% |
| Range | 8.9% | 33.1% |
| Mean | 4.2% | 5.4% |
| Median | 4.4% | 4.4% |
| Interquartile 25% (IQ1) | 2.4% | 2.9% |
| Interquartile 75% (IQ3) | 5.6% | 5.6% |
| Interquartile Range (IQR) | 3.2% | 2.7% |
| Standard Deviation (Sample) | 2.2% | 5.9% |
| Standard Deviation (Population) | 2.2% | 5.8% |
Demographics Similar to Hmong and Cape Verdeans by Unemployment Among Ages 60 to 64 years
In terms of unemployment among ages 60 to 64 years, the demographic groups most similar to Hmong are Immigrants from the Azores (4.0%, a difference of 0.010%), Chinese (4.0%, a difference of 0.42%), Immigrants from Congo (4.1%, a difference of 2.7%), Lumbee (4.2%, a difference of 3.7%), and Immigrants from Micronesia (4.2%, a difference of 4.9%). Similarly, the demographic groups most similar to Cape Verdeans are Afghan (4.4%, a difference of 0.080%), Immigrants from Cabo Verde (4.4%, a difference of 0.080%), Immigrants from Zaire (4.4%, a difference of 0.20%), Tsimshian (4.4%, a difference of 0.23%), and Slovene (4.4%, a difference of 0.33%).
| Demographics | Rating | Rank | Unemployment Among Ages 60 to 64 years |
| Chinese | 100.0 /100 | #3 | Exceptional 4.0% |
| Hmong | 100.0 /100 | #4 | Exceptional 4.0% |
| Immigrants | Azores | 100.0 /100 | #5 | Exceptional 4.0% |
| Immigrants | Congo | 100.0 /100 | #6 | Exceptional 4.1% |
| Lumbee | 100.0 /100 | #7 | Exceptional 4.2% |
| Immigrants | Micronesia | 100.0 /100 | #8 | Exceptional 4.2% |
| Indonesians | 100.0 /100 | #9 | Exceptional 4.2% |
| Immigrants | Bosnia and Herzegovina | 100.0 /100 | #10 | Exceptional 4.2% |
| Luxembourgers | 100.0 /100 | #11 | Exceptional 4.3% |
| Immigrants | Cuba | 100.0 /100 | #12 | Exceptional 4.3% |
| Chickasaw | 100.0 /100 | #13 | Exceptional 4.3% |
| Norwegians | 100.0 /100 | #14 | Exceptional 4.3% |
| Sudanese | 100.0 /100 | #15 | Exceptional 4.3% |
| Danes | 100.0 /100 | #16 | Exceptional 4.4% |
| Immigrants | Afghanistan | 100.0 /100 | #17 | Exceptional 4.4% |
| Slovenes | 100.0 /100 | #18 | Exceptional 4.4% |
| Tsimshian | 100.0 /100 | #19 | Exceptional 4.4% |
| Afghans | 100.0 /100 | #20 | Exceptional 4.4% |
| Immigrants | Cabo Verde | 100.0 /100 | #21 | Exceptional 4.4% |
| Cape Verdeans | 100.0 /100 | #22 | Exceptional 4.4% |
| Immigrants | Zaire | 100.0 /100 | #23 | Exceptional 4.4% |