Nicaraguan vs Cape Verdean 12th Grade, No Diploma
COMPARE
Nicaraguan
Cape Verdean
12th Grade, No Diploma
12th Grade, No Diploma Comparison
Nicaraguans
Cape Verdeans
87.3%
12TH GRADE, NO DIPLOMA
0.0/ 100
METRIC RATING
315th/ 347
METRIC RANK
87.4%
12TH GRADE, NO DIPLOMA
0.0/ 100
METRIC RATING
314th/ 347
METRIC RANK
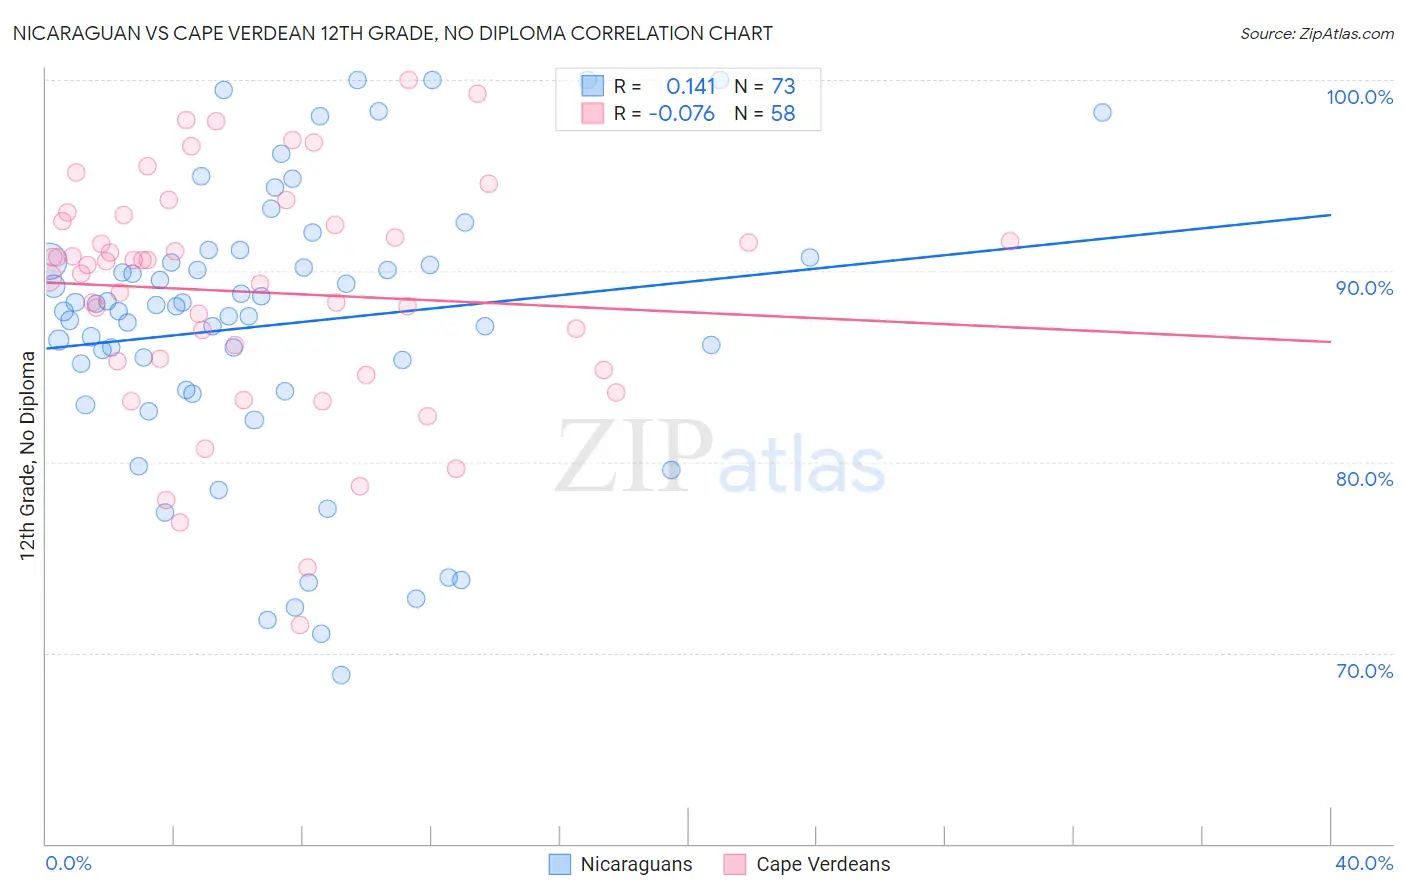
Nicaraguan vs Cape Verdean 12th Grade, No Diploma Correlation Chart
The statistical analysis conducted on geographies consisting of 285,711,651 people shows a poor positive correlation between the proportion of Nicaraguans and percentage of population with at least 12th grade (no diploma) education in the United States with a correlation coefficient (R) of 0.141 and weighted average of 87.3%. Similarly, the statistical analysis conducted on geographies consisting of 107,537,955 people shows a slight negative correlation between the proportion of Cape Verdeans and percentage of population with at least 12th grade (no diploma) education in the United States with a correlation coefficient (R) of -0.076 and weighted average of 87.4%, a difference of 0.040%.
12th Grade, No Diploma Correlation Summary
| Measurement | Nicaraguan | Cape Verdean |
| Minimum | 68.9% | 71.4% |
| Maximum | 100.0% | 100.0% |
| Range | 31.1% | 28.6% |
| Mean | 87.2% | 88.9% |
| Median | 88.1% | 90.4% |
| Interquartile 25% (IQ1) | 83.7% | 85.3% |
| Interquartile 75% (IQ3) | 90.6% | 92.6% |
| Interquartile Range (IQR) | 6.9% | 7.3% |
| Standard Deviation (Sample) | 7.4% | 6.1% |
| Standard Deviation (Population) | 7.4% | 6.1% |
Demographics Similar to Nicaraguans and Cape Verdeans by 12th Grade, No Diploma
In terms of 12th grade, no diploma, the demographic groups most similar to Nicaraguans are Apache (87.3%, a difference of 0.010%), Immigrants from Caribbean (87.4%, a difference of 0.050%), Yaqui (87.5%, a difference of 0.17%), Immigrants from Ecuador (87.5%, a difference of 0.17%), and Immigrants from Cuba (87.5%, a difference of 0.21%). Similarly, the demographic groups most similar to Cape Verdeans are Immigrants from Caribbean (87.4%, a difference of 0.020%), Apache (87.3%, a difference of 0.050%), Immigrants from Ecuador (87.5%, a difference of 0.13%), Yaqui (87.5%, a difference of 0.14%), and Immigrants from Cuba (87.5%, a difference of 0.18%).
| Demographics | Rating | Rank | 12th Grade, No Diploma |
| Vietnamese | 0.0 /100 | #304 | Tragic 87.9% |
| Immigrants | Dominica | 0.0 /100 | #305 | Tragic 87.7% |
| Natives/Alaskans | 0.0 /100 | #306 | Tragic 87.7% |
| Immigrants | Portugal | 0.0 /100 | #307 | Tragic 87.6% |
| Yup'ik | 0.0 /100 | #308 | Tragic 87.6% |
| Immigrants | Armenia | 0.0 /100 | #309 | Tragic 87.6% |
| Immigrants | Cuba | 0.0 /100 | #310 | Tragic 87.5% |
| Yaqui | 0.0 /100 | #311 | Tragic 87.5% |
| Immigrants | Ecuador | 0.0 /100 | #312 | Tragic 87.5% |
| Immigrants | Caribbean | 0.0 /100 | #313 | Tragic 87.4% |
| Cape Verdeans | 0.0 /100 | #314 | Tragic 87.4% |
| Nicaraguans | 0.0 /100 | #315 | Tragic 87.3% |
| Apache | 0.0 /100 | #316 | Tragic 87.3% |
| Navajo | 0.0 /100 | #317 | Tragic 87.1% |
| Belizeans | 0.0 /100 | #318 | Tragic 87.0% |
| Immigrants | Belize | 0.0 /100 | #319 | Tragic 87.0% |
| Immigrants | Nicaragua | 0.0 /100 | #320 | Tragic 86.6% |
| Puerto Ricans | 0.0 /100 | #321 | Tragic 86.5% |
| Central American Indians | 0.0 /100 | #322 | Tragic 86.5% |
| Yuman | 0.0 /100 | #323 | Tragic 86.5% |
| Immigrants | Cabo Verde | 0.0 /100 | #324 | Tragic 85.8% |