Central American Indian vs Cape Verdean 12th Grade, No Diploma
COMPARE
Central American Indian
Cape Verdean
12th Grade, No Diploma
12th Grade, No Diploma Comparison
Central American Indians
Cape Verdeans
86.5%
12TH GRADE, NO DIPLOMA
0.0/ 100
METRIC RATING
322nd/ 347
METRIC RANK
87.4%
12TH GRADE, NO DIPLOMA
0.0/ 100
METRIC RATING
314th/ 347
METRIC RANK
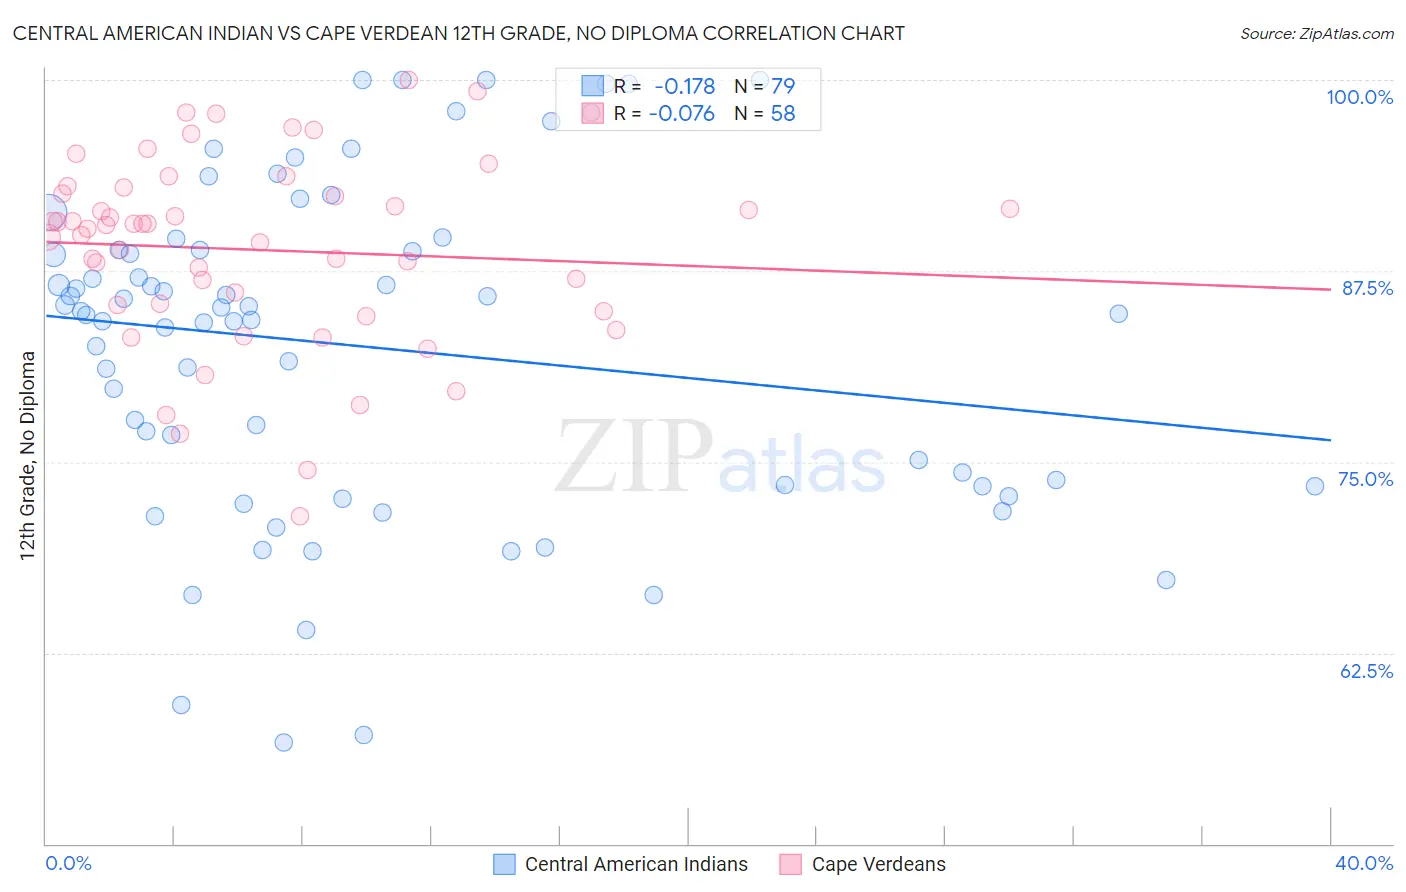
Central American Indian vs Cape Verdean 12th Grade, No Diploma Correlation Chart
The statistical analysis conducted on geographies consisting of 326,142,643 people shows a poor negative correlation between the proportion of Central American Indians and percentage of population with at least 12th grade (no diploma) education in the United States with a correlation coefficient (R) of -0.178 and weighted average of 86.5%. Similarly, the statistical analysis conducted on geographies consisting of 107,537,955 people shows a slight negative correlation between the proportion of Cape Verdeans and percentage of population with at least 12th grade (no diploma) education in the United States with a correlation coefficient (R) of -0.076 and weighted average of 87.4%, a difference of 1.1%.
12th Grade, No Diploma Correlation Summary
| Measurement | Central American Indian | Cape Verdean |
| Minimum | 56.6% | 71.4% |
| Maximum | 100.0% | 100.0% |
| Range | 43.4% | 28.6% |
| Mean | 82.5% | 88.9% |
| Median | 84.7% | 90.4% |
| Interquartile 25% (IQ1) | 73.4% | 85.3% |
| Interquartile 75% (IQ3) | 88.9% | 92.6% |
| Interquartile Range (IQR) | 15.4% | 7.3% |
| Standard Deviation (Sample) | 10.8% | 6.1% |
| Standard Deviation (Population) | 10.7% | 6.1% |
Demographics Similar to Central American Indians and Cape Verdeans by 12th Grade, No Diploma
In terms of 12th grade, no diploma, the demographic groups most similar to Central American Indians are Yuman (86.5%, a difference of 0.0%), Puerto Rican (86.5%, a difference of 0.080%), Immigrants from Nicaragua (86.6%, a difference of 0.10%), Immigrants from Belize (87.0%, a difference of 0.57%), and Belizean (87.0%, a difference of 0.65%). Similarly, the demographic groups most similar to Cape Verdeans are Immigrants from Caribbean (87.4%, a difference of 0.020%), Nicaraguan (87.3%, a difference of 0.040%), Apache (87.3%, a difference of 0.050%), Immigrants from Ecuador (87.5%, a difference of 0.13%), and Yaqui (87.5%, a difference of 0.14%).
| Demographics | Rating | Rank | 12th Grade, No Diploma |
| Yup'ik | 0.0 /100 | #308 | Tragic 87.6% |
| Immigrants | Armenia | 0.0 /100 | #309 | Tragic 87.6% |
| Immigrants | Cuba | 0.0 /100 | #310 | Tragic 87.5% |
| Yaqui | 0.0 /100 | #311 | Tragic 87.5% |
| Immigrants | Ecuador | 0.0 /100 | #312 | Tragic 87.5% |
| Immigrants | Caribbean | 0.0 /100 | #313 | Tragic 87.4% |
| Cape Verdeans | 0.0 /100 | #314 | Tragic 87.4% |
| Nicaraguans | 0.0 /100 | #315 | Tragic 87.3% |
| Apache | 0.0 /100 | #316 | Tragic 87.3% |
| Navajo | 0.0 /100 | #317 | Tragic 87.1% |
| Belizeans | 0.0 /100 | #318 | Tragic 87.0% |
| Immigrants | Belize | 0.0 /100 | #319 | Tragic 87.0% |
| Immigrants | Nicaragua | 0.0 /100 | #320 | Tragic 86.6% |
| Puerto Ricans | 0.0 /100 | #321 | Tragic 86.5% |
| Central American Indians | 0.0 /100 | #322 | Tragic 86.5% |
| Yuman | 0.0 /100 | #323 | Tragic 86.5% |
| Immigrants | Cabo Verde | 0.0 /100 | #324 | Tragic 85.8% |
| Mexican American Indians | 0.0 /100 | #325 | Tragic 85.7% |
| Dominicans | 0.0 /100 | #326 | Tragic 85.7% |
| Lumbee | 0.0 /100 | #327 | Tragic 85.7% |
| Hondurans | 0.0 /100 | #328 | Tragic 85.5% |