Hmong vs Bangladeshi Unemployment Among Ages 35 to 44 years
COMPARE
Hmong
Bangladeshi
Unemployment Among Ages 35 to 44 years
Unemployment Among Ages 35 to 44 years Comparison
Hmong
Bangladeshis
5.0%
UNEMPLOYMENT AMONG AGES 35 TO 44 YEARS
3.5/ 100
METRIC RATING
222nd/ 347
METRIC RANK
4.8%
UNEMPLOYMENT AMONG AGES 35 TO 44 YEARS
28.0/ 100
METRIC RATING
195th/ 347
METRIC RANK
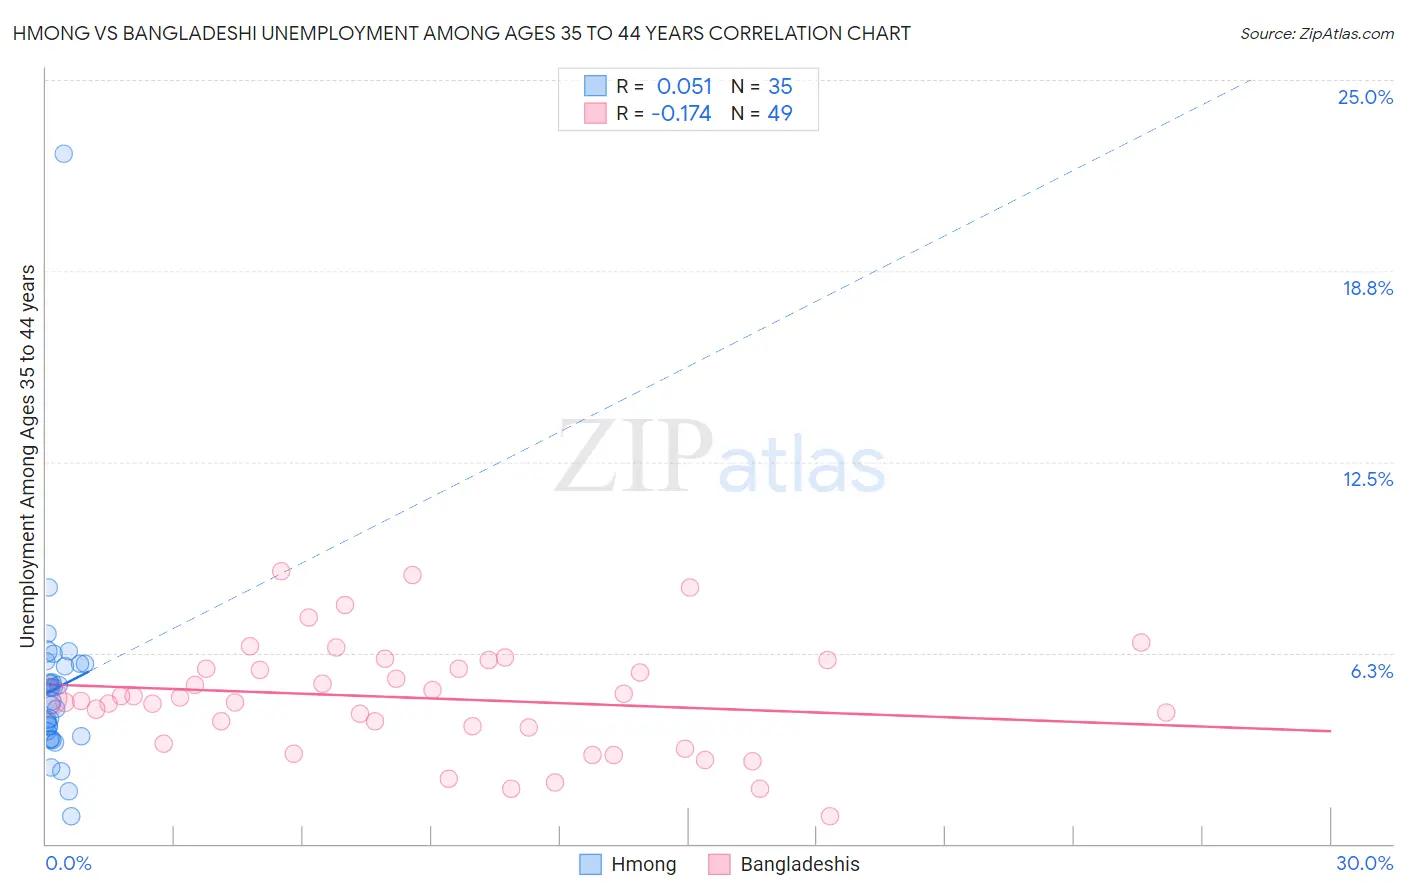
Hmong vs Bangladeshi Unemployment Among Ages 35 to 44 years Correlation Chart
The statistical analysis conducted on geographies consisting of 24,641,754 people shows a slight positive correlation between the proportion of Hmong and unemployment rate among population between the ages 35 and 44 in the United States with a correlation coefficient (R) of 0.051 and weighted average of 5.0%. Similarly, the statistical analysis conducted on geographies consisting of 140,148,247 people shows a poor negative correlation between the proportion of Bangladeshis and unemployment rate among population between the ages 35 and 44 in the United States with a correlation coefficient (R) of -0.174 and weighted average of 4.8%, a difference of 4.1%.
Unemployment Among Ages 35 to 44 years Correlation Summary
| Measurement | Hmong | Bangladeshi |
| Minimum | 0.90% | 0.90% |
| Maximum | 22.6% | 8.9% |
| Range | 21.7% | 8.0% |
| Mean | 5.1% | 4.8% |
| Median | 4.7% | 4.8% |
| Interquartile 25% (IQ1) | 3.5% | 3.5% |
| Interquartile 75% (IQ3) | 5.9% | 5.9% |
| Interquartile Range (IQR) | 2.4% | 2.3% |
| Standard Deviation (Sample) | 3.4% | 1.8% |
| Standard Deviation (Population) | 3.4% | 1.8% |
Similar Demographics by Unemployment Among Ages 35 to 44 years
Demographics Similar to Hmong by Unemployment Among Ages 35 to 44 years
In terms of unemployment among ages 35 to 44 years, the demographic groups most similar to Hmong are Immigrants from Panama (5.0%, a difference of 0.080%), Bermudan (5.0%, a difference of 0.19%), Panamanian (5.0%, a difference of 0.31%), Immigrants from Lebanon (5.0%, a difference of 0.43%), and Immigrants from Sierra Leone (4.9%, a difference of 0.51%).
| Demographics | Rating | Rank | Unemployment Among Ages 35 to 44 years |
| Immigrants | Immigrants | 8.0 /100 | #215 | Tragic 4.9% |
| Americans | 6.2 /100 | #216 | Tragic 4.9% |
| Moroccans | 6.0 /100 | #217 | Tragic 4.9% |
| Chickasaw | 5.7 /100 | #218 | Tragic 4.9% |
| Sierra Leoneans | 4.8 /100 | #219 | Tragic 4.9% |
| Immigrants | Sierra Leone | 4.7 /100 | #220 | Tragic 4.9% |
| Bermudans | 3.9 /100 | #221 | Tragic 5.0% |
| Hmong | 3.5 /100 | #222 | Tragic 5.0% |
| Immigrants | Panama | 3.3 /100 | #223 | Tragic 5.0% |
| Panamanians | 2.9 /100 | #224 | Tragic 5.0% |
| Immigrants | Lebanon | 2.7 /100 | #225 | Tragic 5.0% |
| Potawatomi | 2.5 /100 | #226 | Tragic 5.0% |
| Immigrants | Uzbekistan | 1.9 /100 | #227 | Tragic 5.0% |
| Samoans | 1.8 /100 | #228 | Tragic 5.0% |
| Immigrants | Cambodia | 1.5 /100 | #229 | Tragic 5.0% |
Demographics Similar to Bangladeshis by Unemployment Among Ages 35 to 44 years
In terms of unemployment among ages 35 to 44 years, the demographic groups most similar to Bangladeshis are Korean (4.8%, a difference of 0.010%), Immigrants from Albania (4.8%, a difference of 0.21%), Spanish (4.8%, a difference of 0.21%), Immigrants from Syria (4.8%, a difference of 0.39%), and Immigrants from Oceania (4.8%, a difference of 0.44%).
| Demographics | Rating | Rank | Unemployment Among Ages 35 to 44 years |
| Immigrants | Laos | 34.5 /100 | #188 | Fair 4.7% |
| Immigrants | Congo | 33.9 /100 | #189 | Fair 4.7% |
| Immigrants | Southern Europe | 33.8 /100 | #190 | Fair 4.7% |
| Immigrants | South America | 33.8 /100 | #191 | Fair 4.7% |
| Immigrants | Albania | 30.5 /100 | #192 | Fair 4.8% |
| Spanish | 30.4 /100 | #193 | Fair 4.8% |
| Koreans | 28.1 /100 | #194 | Fair 4.8% |
| Bangladeshis | 28.0 /100 | #195 | Fair 4.8% |
| Immigrants | Syria | 23.6 /100 | #196 | Fair 4.8% |
| Immigrants | Oceania | 23.2 /100 | #197 | Fair 4.8% |
| Immigrants | Thailand | 22.9 /100 | #198 | Fair 4.8% |
| Immigrants | Middle Africa | 21.9 /100 | #199 | Fair 4.8% |
| Immigrants | Ukraine | 21.4 /100 | #200 | Fair 4.8% |
| Ugandans | 21.4 /100 | #201 | Fair 4.8% |
| Immigrants | Afghanistan | 20.2 /100 | #202 | Fair 4.8% |