Immigrants from Ghana vs African 4th Grade
COMPARE
Immigrants from Ghana
African
4th Grade
4th Grade Comparison
Immigrants from Ghana
Africans
96.9%
4TH GRADE
0.1/ 100
METRIC RATING
275th/ 347
METRIC RANK
97.4%
4TH GRADE
14.6/ 100
METRIC RATING
204th/ 347
METRIC RANK
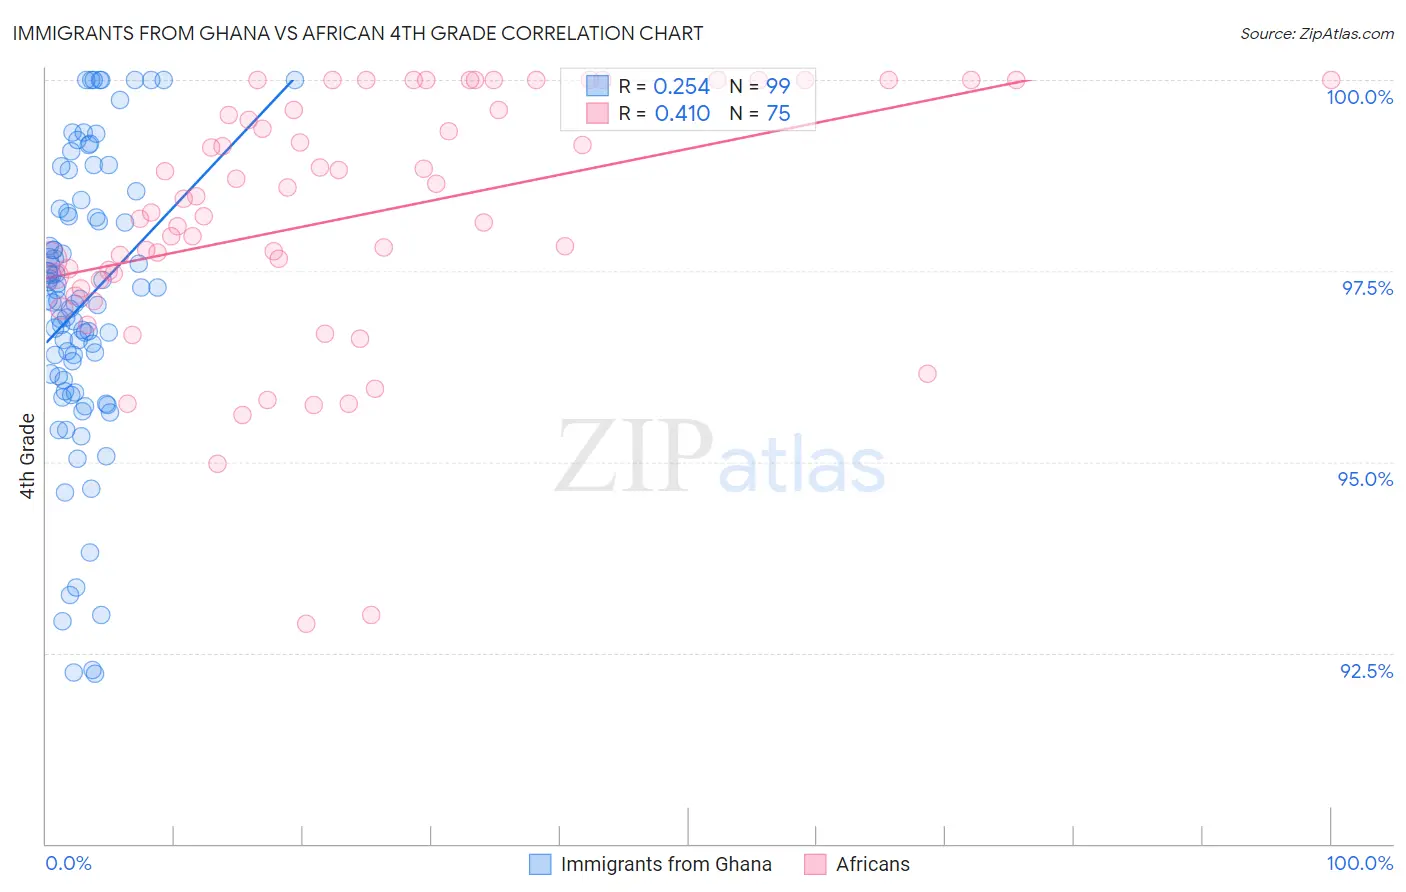
Immigrants from Ghana vs African 4th Grade Correlation Chart
The statistical analysis conducted on geographies consisting of 199,952,023 people shows a weak positive correlation between the proportion of Immigrants from Ghana and percentage of population with at least 4th grade education in the United States with a correlation coefficient (R) of 0.254 and weighted average of 96.9%. Similarly, the statistical analysis conducted on geographies consisting of 470,094,744 people shows a moderate positive correlation between the proportion of Africans and percentage of population with at least 4th grade education in the United States with a correlation coefficient (R) of 0.410 and weighted average of 97.4%, a difference of 0.48%.
4th Grade Correlation Summary
| Measurement | Immigrants from Ghana | African |
| Minimum | 92.2% | 92.9% |
| Maximum | 100.0% | 100.0% |
| Range | 7.8% | 7.1% |
| Mean | 97.1% | 98.2% |
| Median | 97.1% | 98.3% |
| Interquartile 25% (IQ1) | 96.1% | 97.4% |
| Interquartile 75% (IQ3) | 98.3% | 99.6% |
| Interquartile Range (IQR) | 2.2% | 2.2% |
| Standard Deviation (Sample) | 1.9% | 1.6% |
| Standard Deviation (Population) | 1.8% | 1.6% |
Similar Demographics by 4th Grade
Demographics Similar to Immigrants from Ghana by 4th Grade
In terms of 4th grade, the demographic groups most similar to Immigrants from Ghana are Yaqui (96.9%, a difference of 0.0%), Trinidadian and Tobagonian (96.9%, a difference of 0.010%), Immigrants from Western Africa (96.9%, a difference of 0.010%), Immigrants from Bolivia (96.9%, a difference of 0.010%), and Immigrants from Peru (96.9%, a difference of 0.020%).
| Demographics | Rating | Rank | 4th Grade |
| Ghanaians | 0.2 /100 | #268 | Tragic 97.0% |
| Immigrants | Uzbekistan | 0.2 /100 | #269 | Tragic 96.9% |
| Cubans | 0.2 /100 | #270 | Tragic 96.9% |
| Immigrants | Peru | 0.1 /100 | #271 | Tragic 96.9% |
| Fijians | 0.1 /100 | #272 | Tragic 96.9% |
| Immigrants | Cameroon | 0.1 /100 | #273 | Tragic 96.9% |
| Trinidadians and Tobagonians | 0.1 /100 | #274 | Tragic 96.9% |
| Immigrants | Ghana | 0.1 /100 | #275 | Tragic 96.9% |
| Yaqui | 0.1 /100 | #276 | Tragic 96.9% |
| Immigrants | Western Africa | 0.1 /100 | #277 | Tragic 96.9% |
| Immigrants | Bolivia | 0.1 /100 | #278 | Tragic 96.9% |
| Afghans | 0.1 /100 | #279 | Tragic 96.9% |
| Barbadians | 0.1 /100 | #280 | Tragic 96.9% |
| Immigrants | Hong Kong | 0.1 /100 | #281 | Tragic 96.9% |
| Immigrants | Trinidad and Tobago | 0.1 /100 | #282 | Tragic 96.8% |
Demographics Similar to Africans by 4th Grade
In terms of 4th grade, the demographic groups most similar to Africans are Immigrants from Northern Africa (97.4%, a difference of 0.0%), Immigrants from Southern Europe (97.4%, a difference of 0.010%), Immigrants from Chile (97.4%, a difference of 0.010%), Paiute (97.3%, a difference of 0.010%), and Immigrants from Zaire (97.3%, a difference of 0.010%).
| Demographics | Rating | Rank | 4th Grade |
| Hawaiians | 25.6 /100 | #197 | Fair 97.4% |
| Guamanians/Chamorros | 23.0 /100 | #198 | Fair 97.4% |
| Natives/Alaskans | 20.6 /100 | #199 | Fair 97.4% |
| Immigrants | Uganda | 19.8 /100 | #200 | Poor 97.4% |
| Immigrants | Southern Europe | 16.2 /100 | #201 | Poor 97.4% |
| Immigrants | Chile | 16.1 /100 | #202 | Poor 97.4% |
| Immigrants | Northern Africa | 15.1 /100 | #203 | Poor 97.4% |
| Africans | 14.6 /100 | #204 | Poor 97.4% |
| Paiute | 13.2 /100 | #205 | Poor 97.3% |
| Immigrants | Zaire | 12.8 /100 | #206 | Poor 97.3% |
| Moroccans | 11.3 /100 | #207 | Poor 97.3% |
| Immigrants | Bahamas | 10.8 /100 | #208 | Poor 97.3% |
| Laotians | 9.3 /100 | #209 | Tragic 97.3% |
| Immigrants | Oceania | 9.1 /100 | #210 | Tragic 97.3% |
| Sudanese | 9.0 /100 | #211 | Tragic 97.3% |