Bulgarian vs Laotian 3rd Grade
COMPARE
Bulgarian
Laotian
3rd Grade
3rd Grade Comparison
Bulgarians
Laotians
98.3%
3RD GRADE
99.8/ 100
METRIC RATING
54th/ 347
METRIC RANK
97.6%
3RD GRADE
9.4/ 100
METRIC RATING
211th/ 347
METRIC RANK
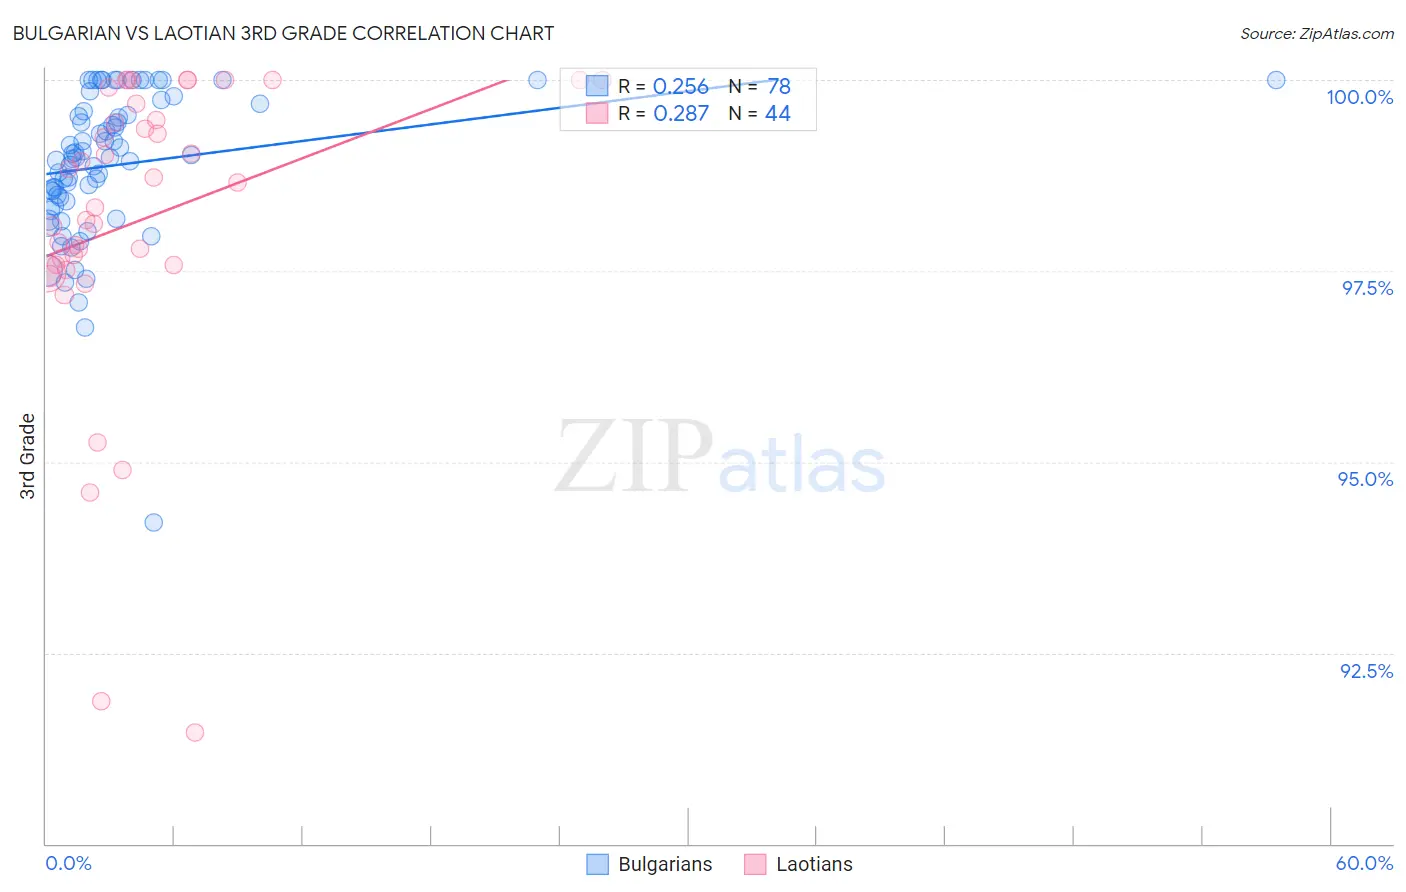
Bulgarian vs Laotian 3rd Grade Correlation Chart
The statistical analysis conducted on geographies consisting of 205,633,223 people shows a weak positive correlation between the proportion of Bulgarians and percentage of population with at least 3rd grade education in the United States with a correlation coefficient (R) of 0.256 and weighted average of 98.3%. Similarly, the statistical analysis conducted on geographies consisting of 224,856,650 people shows a weak positive correlation between the proportion of Laotians and percentage of population with at least 3rd grade education in the United States with a correlation coefficient (R) of 0.287 and weighted average of 97.6%, a difference of 0.70%.
3rd Grade Correlation Summary
| Measurement | Bulgarian | Laotian |
| Minimum | 94.2% | 91.5% |
| Maximum | 100.0% | 100.0% |
| Range | 5.8% | 8.5% |
| Mean | 98.9% | 98.2% |
| Median | 99.0% | 98.5% |
| Interquartile 25% (IQ1) | 98.4% | 97.6% |
| Interquartile 75% (IQ3) | 99.6% | 99.6% |
| Interquartile Range (IQR) | 1.2% | 2.0% |
| Standard Deviation (Sample) | 0.98% | 2.0% |
| Standard Deviation (Population) | 0.97% | 2.0% |
Similar Demographics by 3rd Grade
Demographics Similar to Bulgarians by 3rd Grade
In terms of 3rd grade, the demographic groups most similar to Bulgarians are American (98.3%, a difference of 0.0%), Austrian (98.3%, a difference of 0.0%), White/Caucasian (98.3%, a difference of 0.010%), Immigrants from Scotland (98.3%, a difference of 0.010%), and Slavic (98.3%, a difference of 0.010%).
| Demographics | Rating | Rank | 3rd Grade |
| Czechoslovakians | 99.8 /100 | #47 | Exceptional 98.3% |
| Lumbee | 99.8 /100 | #48 | Exceptional 98.3% |
| Estonians | 99.8 /100 | #49 | Exceptional 98.3% |
| Celtics | 99.8 /100 | #50 | Exceptional 98.3% |
| Australians | 99.8 /100 | #51 | Exceptional 98.3% |
| Whites/Caucasians | 99.8 /100 | #52 | Exceptional 98.3% |
| Immigrants | Scotland | 99.8 /100 | #53 | Exceptional 98.3% |
| Bulgarians | 99.8 /100 | #54 | Exceptional 98.3% |
| Americans | 99.8 /100 | #55 | Exceptional 98.3% |
| Austrians | 99.8 /100 | #56 | Exceptional 98.3% |
| Slavs | 99.7 /100 | #57 | Exceptional 98.3% |
| Greeks | 99.7 /100 | #58 | Exceptional 98.3% |
| Maltese | 99.7 /100 | #59 | Exceptional 98.3% |
| Creek | 99.7 /100 | #60 | Exceptional 98.2% |
| Pueblo | 99.7 /100 | #61 | Exceptional 98.2% |
Demographics Similar to Laotians by 3rd Grade
In terms of 3rd grade, the demographic groups most similar to Laotians are Costa Rican (97.6%, a difference of 0.0%), Immigrants from Oceania (97.6%, a difference of 0.0%), Immigrants from Bahamas (97.6%, a difference of 0.010%), Moroccan (97.6%, a difference of 0.010%), and Yuman (97.6%, a difference of 0.010%).
| Demographics | Rating | Rank | 3rd Grade |
| Immigrants | Chile | 16.5 /100 | #204 | Poor 97.6% |
| Africans | 14.5 /100 | #205 | Poor 97.6% |
| Immigrants | Northern Africa | 13.0 /100 | #206 | Poor 97.6% |
| Tohono O'odham | 12.5 /100 | #207 | Poor 97.6% |
| Immigrants | Zaire | 11.9 /100 | #208 | Poor 97.6% |
| Costa Ricans | 9.6 /100 | #209 | Tragic 97.6% |
| Immigrants | Oceania | 9.5 /100 | #210 | Tragic 97.6% |
| Laotians | 9.4 /100 | #211 | Tragic 97.6% |
| Immigrants | Bahamas | 8.5 /100 | #212 | Tragic 97.6% |
| Moroccans | 8.5 /100 | #213 | Tragic 97.6% |
| Yuman | 8.4 /100 | #214 | Tragic 97.6% |
| Iraqis | 6.9 /100 | #215 | Tragic 97.5% |
| Samoans | 6.9 /100 | #216 | Tragic 97.5% |
| South American Indians | 5.7 /100 | #217 | Tragic 97.5% |
| Immigrants | Nepal | 5.3 /100 | #218 | Tragic 97.5% |