Hispanic or Latino vs Czechoslovakian 3rd Grade
COMPARE
Hispanic or Latino
Czechoslovakian
3rd Grade
3rd Grade Comparison
Hispanics or Latinos
Czechoslovakians
96.5%
3RD GRADE
0.0/ 100
METRIC RATING
318th/ 347
METRIC RANK
98.3%
3RD GRADE
99.8/ 100
METRIC RATING
47th/ 347
METRIC RANK
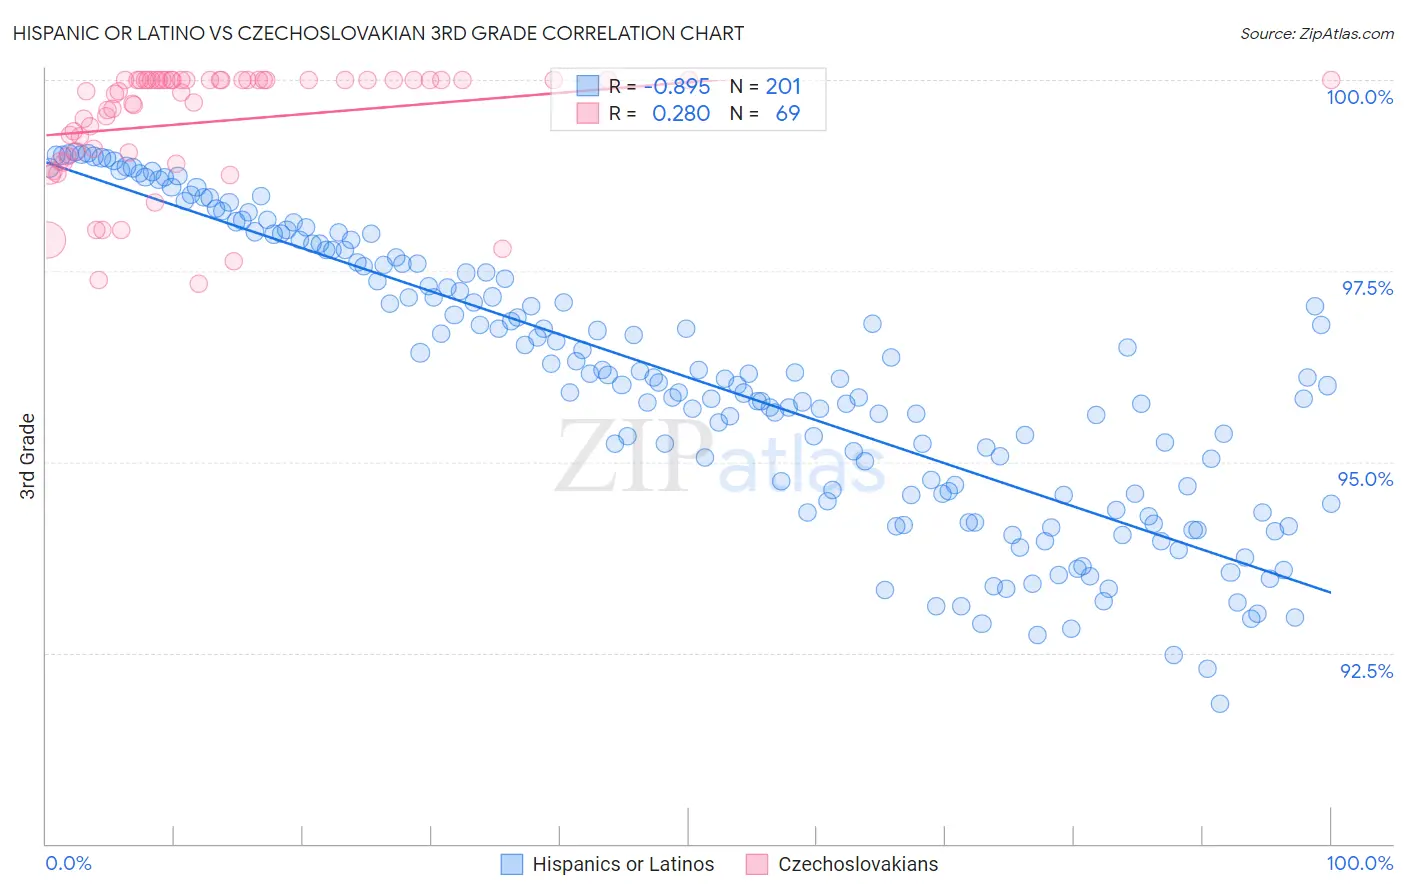
Hispanic or Latino vs Czechoslovakian 3rd Grade Correlation Chart
The statistical analysis conducted on geographies consisting of 578,615,396 people shows a very strong negative correlation between the proportion of Hispanics or Latinos and percentage of population with at least 3rd grade education in the United States with a correlation coefficient (R) of -0.895 and weighted average of 96.5%. Similarly, the statistical analysis conducted on geographies consisting of 368,668,876 people shows a weak positive correlation between the proportion of Czechoslovakians and percentage of population with at least 3rd grade education in the United States with a correlation coefficient (R) of 0.280 and weighted average of 98.3%, a difference of 1.8%.
3rd Grade Correlation Summary
| Measurement | Hispanic or Latino | Czechoslovakian |
| Minimum | 91.8% | 97.3% |
| Maximum | 99.1% | 100.0% |
| Range | 7.2% | 2.7% |
| Mean | 96.1% | 99.5% |
| Median | 96.1% | 99.9% |
| Interquartile 25% (IQ1) | 94.6% | 99.0% |
| Interquartile 75% (IQ3) | 97.6% | 100.0% |
| Interquartile Range (IQR) | 3.1% | 0.98% |
| Standard Deviation (Sample) | 1.8% | 0.76% |
| Standard Deviation (Population) | 1.8% | 0.75% |
Similar Demographics by 3rd Grade
Demographics Similar to Hispanics or Latinos by 3rd Grade
In terms of 3rd grade, the demographic groups most similar to Hispanics or Latinos are Vietnamese (96.5%, a difference of 0.010%), Immigrants from Bangladesh (96.6%, a difference of 0.020%), Immigrants from Nicaragua (96.5%, a difference of 0.020%), Indonesian (96.5%, a difference of 0.030%), and Immigrants from Belize (96.5%, a difference of 0.030%).
| Demographics | Rating | Rank | 3rd Grade |
| Immigrants | Guyana | 0.0 /100 | #311 | Tragic 96.6% |
| Immigrants | Laos | 0.0 /100 | #312 | Tragic 96.6% |
| Immigrants | Ecuador | 0.0 /100 | #313 | Tragic 96.6% |
| Belizeans | 0.0 /100 | #314 | Tragic 96.6% |
| Immigrants | Azores | 0.0 /100 | #315 | Tragic 96.6% |
| Immigrants | Burma/Myanmar | 0.0 /100 | #316 | Tragic 96.6% |
| Immigrants | Bangladesh | 0.0 /100 | #317 | Tragic 96.6% |
| Hispanics or Latinos | 0.0 /100 | #318 | Tragic 96.5% |
| Vietnamese | 0.0 /100 | #319 | Tragic 96.5% |
| Immigrants | Nicaragua | 0.0 /100 | #320 | Tragic 96.5% |
| Indonesians | 0.0 /100 | #321 | Tragic 96.5% |
| Immigrants | Belize | 0.0 /100 | #322 | Tragic 96.5% |
| Hondurans | 0.0 /100 | #323 | Tragic 96.5% |
| Dominicans | 0.0 /100 | #324 | Tragic 96.4% |
| Mexican American Indians | 0.0 /100 | #325 | Tragic 96.4% |
Demographics Similar to Czechoslovakians by 3rd Grade
In terms of 3rd grade, the demographic groups most similar to Czechoslovakians are Ottawa (98.3%, a difference of 0.0%), Lumbee (98.3%, a difference of 0.0%), Estonian (98.3%, a difference of 0.020%), Celtic (98.3%, a difference of 0.020%), and Australian (98.3%, a difference of 0.020%).
| Demographics | Rating | Rank | 3rd Grade |
| Eastern Europeans | 99.9 /100 | #40 | Exceptional 98.3% |
| Luxembourgers | 99.9 /100 | #41 | Exceptional 98.3% |
| Belgians | 99.9 /100 | #42 | Exceptional 98.3% |
| Northern Europeans | 99.9 /100 | #43 | Exceptional 98.3% |
| Hungarians | 99.9 /100 | #44 | Exceptional 98.3% |
| Native Hawaiians | 99.9 /100 | #45 | Exceptional 98.3% |
| Ottawa | 99.8 /100 | #46 | Exceptional 98.3% |
| Czechoslovakians | 99.8 /100 | #47 | Exceptional 98.3% |
| Lumbee | 99.8 /100 | #48 | Exceptional 98.3% |
| Estonians | 99.8 /100 | #49 | Exceptional 98.3% |
| Celtics | 99.8 /100 | #50 | Exceptional 98.3% |
| Australians | 99.8 /100 | #51 | Exceptional 98.3% |
| Whites/Caucasians | 99.8 /100 | #52 | Exceptional 98.3% |
| Immigrants | Scotland | 99.8 /100 | #53 | Exceptional 98.3% |
| Bulgarians | 99.8 /100 | #54 | Exceptional 98.3% |