Hawaiian vs Immigrants from Colombia Bachelor's Degree
COMPARE
Hawaiian
Immigrants from Colombia
Bachelor's Degree
Bachelor's Degree Comparison
Hawaiians
Immigrants from Colombia
31.6%
BACHELOR'S DEGREE
0.1/ 100
METRIC RATING
279th/ 347
METRIC RANK
37.7%
BACHELOR'S DEGREE
45.4/ 100
METRIC RATING
179th/ 347
METRIC RANK
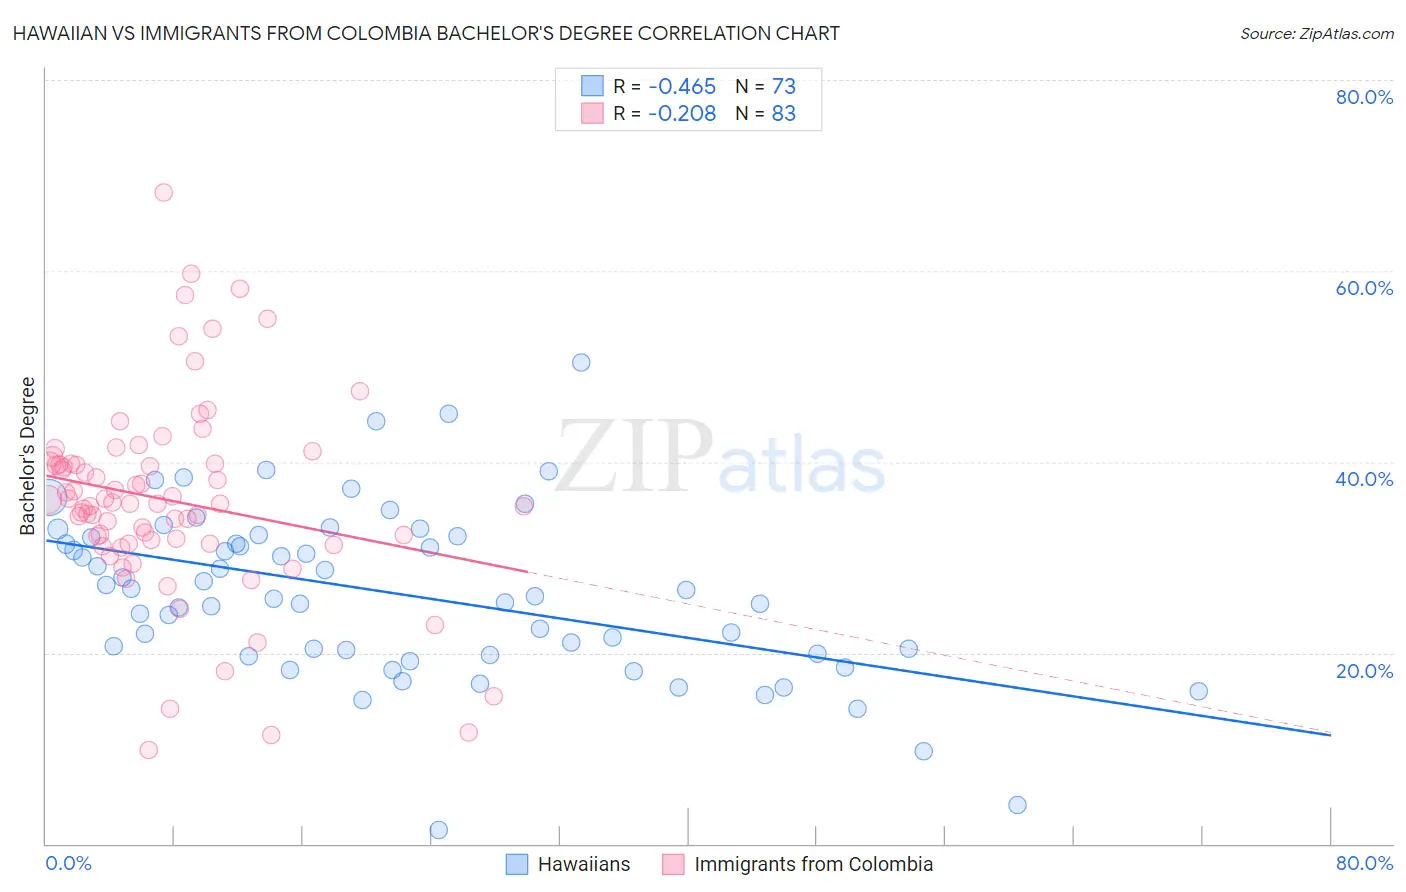
Hawaiian vs Immigrants from Colombia Bachelor's Degree Correlation Chart
The statistical analysis conducted on geographies consisting of 327,580,632 people shows a moderate negative correlation between the proportion of Hawaiians and percentage of population with at least bachelor's degree education in the United States with a correlation coefficient (R) of -0.465 and weighted average of 31.6%. Similarly, the statistical analysis conducted on geographies consisting of 378,673,496 people shows a weak negative correlation between the proportion of Immigrants from Colombia and percentage of population with at least bachelor's degree education in the United States with a correlation coefficient (R) of -0.208 and weighted average of 37.7%, a difference of 19.1%.
Bachelor's Degree Correlation Summary
| Measurement | Hawaiian | Immigrants from Colombia |
| Minimum | 1.4% | 9.8% |
| Maximum | 50.4% | 68.2% |
| Range | 49.0% | 58.4% |
| Mean | 26.2% | 36.0% |
| Median | 26.0% | 35.7% |
| Interquartile 25% (IQ1) | 19.8% | 31.5% |
| Interquartile 75% (IQ3) | 32.1% | 39.8% |
| Interquartile Range (IQR) | 12.3% | 8.3% |
| Standard Deviation (Sample) | 8.9% | 10.3% |
| Standard Deviation (Population) | 8.9% | 10.3% |
Similar Demographics by Bachelor's Degree
Demographics Similar to Hawaiians by Bachelor's Degree
In terms of bachelor's degree, the demographic groups most similar to Hawaiians are Immigrants from Laos (31.6%, a difference of 0.050%), Marshallese (31.7%, a difference of 0.35%), Dominican (31.8%, a difference of 0.40%), Blackfeet (31.5%, a difference of 0.51%), and Salvadoran (31.8%, a difference of 0.55%).
| Demographics | Rating | Rank | Bachelor's Degree |
| Comanche | 0.2 /100 | #272 | Tragic 31.9% |
| Americans | 0.2 /100 | #273 | Tragic 31.9% |
| Potawatomi | 0.2 /100 | #274 | Tragic 31.9% |
| Samoans | 0.1 /100 | #275 | Tragic 31.8% |
| Salvadorans | 0.1 /100 | #276 | Tragic 31.8% |
| Dominicans | 0.1 /100 | #277 | Tragic 31.8% |
| Marshallese | 0.1 /100 | #278 | Tragic 31.7% |
| Hawaiians | 0.1 /100 | #279 | Tragic 31.6% |
| Immigrants | Laos | 0.1 /100 | #280 | Tragic 31.6% |
| Blackfeet | 0.1 /100 | #281 | Tragic 31.5% |
| Immigrants | Caribbean | 0.1 /100 | #282 | Tragic 31.4% |
| Hondurans | 0.1 /100 | #283 | Tragic 31.3% |
| Haitians | 0.1 /100 | #284 | Tragic 31.3% |
| Aleuts | 0.1 /100 | #285 | Tragic 31.3% |
| Immigrants | El Salvador | 0.1 /100 | #286 | Tragic 31.3% |
Demographics Similar to Immigrants from Colombia by Bachelor's Degree
In terms of bachelor's degree, the demographic groups most similar to Immigrants from Colombia are Irish (37.6%, a difference of 0.11%), Immigrants from Cameroon (37.7%, a difference of 0.13%), Immigrants from Senegal (37.6%, a difference of 0.16%), Basque (37.7%, a difference of 0.19%), and Immigrants from Bosnia and Herzegovina (37.6%, a difference of 0.20%).
| Demographics | Rating | Rank | Bachelor's Degree |
| Immigrants | Somalia | 52.8 /100 | #172 | Average 37.9% |
| Immigrants | Iraq | 52.5 /100 | #173 | Average 37.9% |
| Immigrants | Bangladesh | 50.0 /100 | #174 | Average 37.8% |
| Immigrants | Uruguay | 48.3 /100 | #175 | Average 37.8% |
| Costa Ricans | 47.6 /100 | #176 | Average 37.7% |
| Basques | 47.4 /100 | #177 | Average 37.7% |
| Immigrants | Cameroon | 46.8 /100 | #178 | Average 37.7% |
| Immigrants | Colombia | 45.4 /100 | #179 | Average 37.7% |
| Irish | 44.3 /100 | #180 | Average 37.6% |
| Immigrants | Senegal | 43.8 /100 | #181 | Average 37.6% |
| Immigrants | Bosnia and Herzegovina | 43.4 /100 | #182 | Average 37.6% |
| Senegalese | 42.2 /100 | #183 | Average 37.5% |
| Scandinavians | 41.7 /100 | #184 | Average 37.5% |
| Immigrants | Peru | 41.3 /100 | #185 | Average 37.5% |
| Norwegians | 40.4 /100 | #186 | Average 37.5% |