Immigrants from Spain vs Tohono O'odham Bachelor's Degree
COMPARE
Immigrants from Spain
Tohono O'odham
Bachelor's Degree
Bachelor's Degree Comparison
Immigrants from Spain
Tohono O'odham
44.3%
BACHELOR'S DEGREE
99.9/ 100
METRIC RATING
52nd/ 347
METRIC RANK
24.4%
BACHELOR'S DEGREE
0.0/ 100
METRIC RATING
343rd/ 347
METRIC RANK
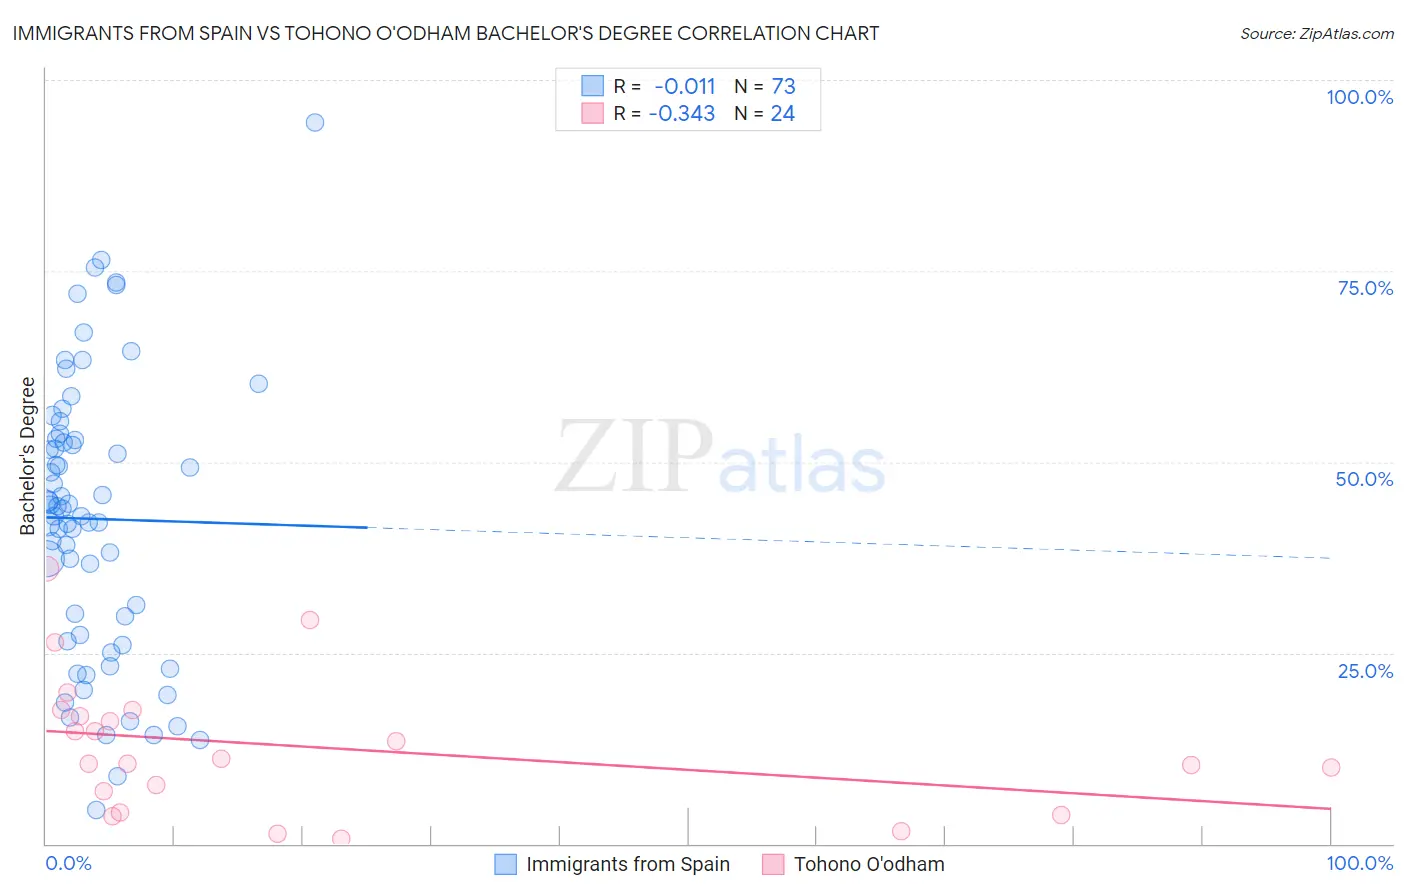
Immigrants from Spain vs Tohono O'odham Bachelor's Degree Correlation Chart
The statistical analysis conducted on geographies consisting of 239,678,363 people shows no correlation between the proportion of Immigrants from Spain and percentage of population with at least bachelor's degree education in the United States with a correlation coefficient (R) of -0.011 and weighted average of 44.3%. Similarly, the statistical analysis conducted on geographies consisting of 58,724,509 people shows a mild negative correlation between the proportion of Tohono O'odham and percentage of population with at least bachelor's degree education in the United States with a correlation coefficient (R) of -0.343 and weighted average of 24.4%, a difference of 81.5%.
Bachelor's Degree Correlation Summary
| Measurement | Immigrants from Spain | Tohono O'odham |
| Minimum | 4.4% | 0.61% |
| Maximum | 94.4% | 36.0% |
| Range | 90.0% | 35.4% |
| Mean | 42.5% | 12.7% |
| Median | 43.9% | 10.8% |
| Interquartile 25% (IQ1) | 26.9% | 5.5% |
| Interquartile 75% (IQ3) | 52.9% | 17.1% |
| Interquartile Range (IQR) | 26.1% | 11.6% |
| Standard Deviation (Sample) | 18.3% | 9.0% |
| Standard Deviation (Population) | 18.2% | 8.8% |
Similar Demographics by Bachelor's Degree
Demographics Similar to Immigrants from Spain by Bachelor's Degree
In terms of bachelor's degree, the demographic groups most similar to Immigrants from Spain are Immigrants from Asia (44.3%, a difference of 0.060%), Asian (44.4%, a difference of 0.18%), Immigrants from Austria (44.2%, a difference of 0.24%), Immigrants from Bolivia (44.2%, a difference of 0.25%), and Immigrants from Greece (44.5%, a difference of 0.32%).
| Demographics | Rating | Rank | Bachelor's Degree |
| Immigrants | Kuwait | 99.9 /100 | #45 | Exceptional 44.6% |
| Immigrants | Bulgaria | 99.9 /100 | #46 | Exceptional 44.6% |
| Bolivians | 99.9 /100 | #47 | Exceptional 44.6% |
| Estonians | 99.9 /100 | #48 | Exceptional 44.6% |
| Immigrants | Norway | 99.9 /100 | #49 | Exceptional 44.5% |
| Immigrants | Greece | 99.9 /100 | #50 | Exceptional 44.5% |
| Asians | 99.9 /100 | #51 | Exceptional 44.4% |
| Immigrants | Spain | 99.9 /100 | #52 | Exceptional 44.3% |
| Immigrants | Asia | 99.9 /100 | #53 | Exceptional 44.3% |
| Immigrants | Austria | 99.9 /100 | #54 | Exceptional 44.2% |
| Immigrants | Bolivia | 99.9 /100 | #55 | Exceptional 44.2% |
| Immigrants | Serbia | 99.9 /100 | #56 | Exceptional 44.1% |
| Paraguayans | 99.9 /100 | #57 | Exceptional 44.0% |
| Immigrants | Czechoslovakia | 99.9 /100 | #58 | Exceptional 44.0% |
| Australians | 99.9 /100 | #59 | Exceptional 44.0% |
Demographics Similar to Tohono O'odham by Bachelor's Degree
In terms of bachelor's degree, the demographic groups most similar to Tohono O'odham are Yakama (24.5%, a difference of 0.20%), Yuman (24.5%, a difference of 0.47%), Lumbee (24.8%, a difference of 1.4%), Navajo (23.6%, a difference of 3.4%), and Hopi (25.3%, a difference of 3.6%).
| Demographics | Rating | Rank | Bachelor's Degree |
| Mexicans | 0.0 /100 | #333 | Tragic 27.1% |
| Arapaho | 0.0 /100 | #334 | Tragic 26.6% |
| Natives/Alaskans | 0.0 /100 | #335 | Tragic 26.3% |
| Immigrants | Mexico | 0.0 /100 | #336 | Tragic 26.1% |
| Inupiat | 0.0 /100 | #337 | Tragic 25.8% |
| Pueblo | 0.0 /100 | #338 | Tragic 25.5% |
| Hopi | 0.0 /100 | #339 | Tragic 25.3% |
| Lumbee | 0.0 /100 | #340 | Tragic 24.8% |
| Yuman | 0.0 /100 | #341 | Tragic 24.5% |
| Yakama | 0.0 /100 | #342 | Tragic 24.5% |
| Tohono O'odham | 0.0 /100 | #343 | Tragic 24.4% |
| Navajo | 0.0 /100 | #344 | Tragic 23.6% |
| Pima | 0.0 /100 | #345 | Tragic 23.2% |
| Houma | 0.0 /100 | #346 | Tragic 21.4% |
| Yup'ik | 0.0 /100 | #347 | Tragic 19.4% |