Haitian vs Lithuanian No Schooling Completed
COMPARE
Haitian
Lithuanian
No Schooling Completed
No Schooling Completed Comparison
Haitians
Lithuanians
2.9%
NO SCHOOLING COMPLETED
0.0/ 100
METRIC RATING
300th/ 347
METRIC RANK
1.4%
NO SCHOOLING COMPLETED
100.0/ 100
METRIC RATING
11th/ 347
METRIC RANK
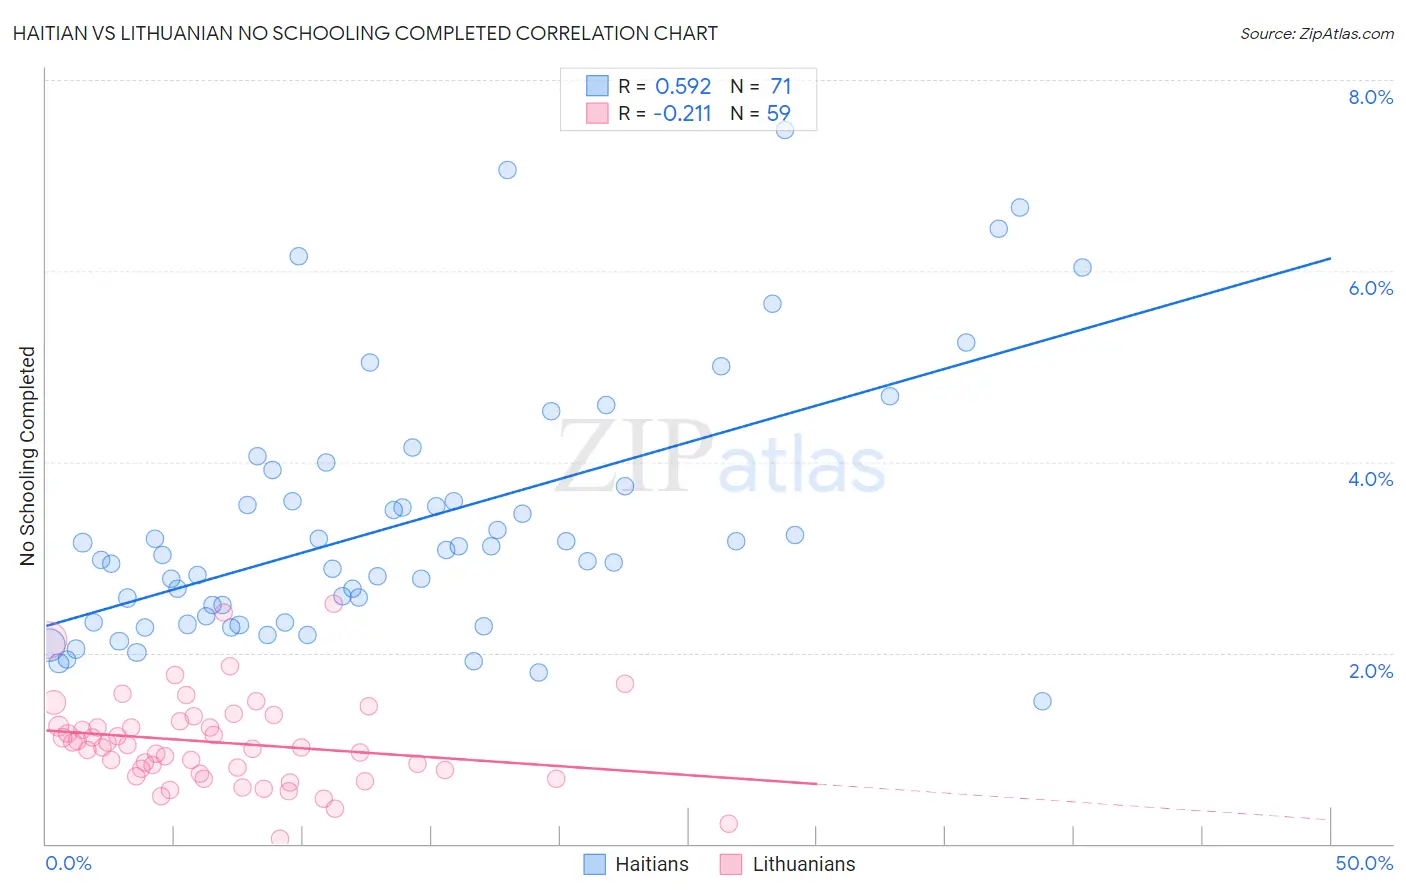
Haitian vs Lithuanian No Schooling Completed Correlation Chart
The statistical analysis conducted on geographies consisting of 286,255,737 people shows a substantial positive correlation between the proportion of Haitians and percentage of population with no schooling in the United States with a correlation coefficient (R) of 0.592 and weighted average of 2.9%. Similarly, the statistical analysis conducted on geographies consisting of 415,193,435 people shows a weak negative correlation between the proportion of Lithuanians and percentage of population with no schooling in the United States with a correlation coefficient (R) of -0.211 and weighted average of 1.4%, a difference of 98.6%.
No Schooling Completed Correlation Summary
| Measurement | Haitian | Lithuanian |
| Minimum | 1.5% | 0.047% |
| Maximum | 7.5% | 2.5% |
| Range | 6.0% | 2.5% |
| Mean | 3.4% | 1.1% |
| Median | 3.0% | 1.0% |
| Interquartile 25% (IQ1) | 2.3% | 0.74% |
| Interquartile 75% (IQ3) | 3.8% | 1.3% |
| Interquartile Range (IQR) | 1.4% | 0.55% |
| Standard Deviation (Sample) | 1.3% | 0.48% |
| Standard Deviation (Population) | 1.3% | 0.47% |
Similar Demographics by No Schooling Completed
Demographics Similar to Haitians by No Schooling Completed
In terms of no schooling completed, the demographic groups most similar to Haitians are Central American Indian (2.8%, a difference of 0.31%), Immigrants from Dominica (2.8%, a difference of 0.83%), Immigrants from Cuba (2.8%, a difference of 1.2%), Immigrants from South Eastern Asia (2.9%, a difference of 1.5%), and Immigrants from Caribbean (2.9%, a difference of 1.9%).
| Demographics | Rating | Rank | No Schooling Completed |
| Malaysians | 0.0 /100 | #293 | Tragic 2.8% |
| Immigrants | Eritrea | 0.0 /100 | #294 | Tragic 2.8% |
| Houma | 0.0 /100 | #295 | Tragic 2.8% |
| Immigrants | Immigrants | 0.0 /100 | #296 | Tragic 2.8% |
| Immigrants | Cuba | 0.0 /100 | #297 | Tragic 2.8% |
| Immigrants | Dominica | 0.0 /100 | #298 | Tragic 2.8% |
| Central American Indians | 0.0 /100 | #299 | Tragic 2.8% |
| Haitians | 0.0 /100 | #300 | Tragic 2.9% |
| Immigrants | South Eastern Asia | 0.0 /100 | #301 | Tragic 2.9% |
| Immigrants | Caribbean | 0.0 /100 | #302 | Tragic 2.9% |
| Somalis | 0.0 /100 | #303 | Tragic 2.9% |
| Nicaraguans | 0.0 /100 | #304 | Tragic 2.9% |
| Ecuadorians | 0.0 /100 | #305 | Tragic 3.0% |
| Belizeans | 0.0 /100 | #306 | Tragic 3.0% |
| Immigrants | Haiti | 0.0 /100 | #307 | Tragic 3.0% |
Demographics Similar to Lithuanians by No Schooling Completed
In terms of no schooling completed, the demographic groups most similar to Lithuanians are Irish (1.4%, a difference of 0.030%), Polish (1.4%, a difference of 0.050%), Dutch (1.4%, a difference of 0.84%), Scotch-Irish (1.5%, a difference of 1.0%), and Tlingit-Haida (1.5%, a difference of 1.1%).
| Demographics | Rating | Rank | No Schooling Completed |
| Germans | 100.0 /100 | #4 | Exceptional 1.4% |
| Slovenes | 100.0 /100 | #5 | Exceptional 1.4% |
| Carpatho Rusyns | 100.0 /100 | #6 | Exceptional 1.4% |
| English | 100.0 /100 | #7 | Exceptional 1.4% |
| Swedes | 100.0 /100 | #8 | Exceptional 1.4% |
| Scottish | 100.0 /100 | #9 | Exceptional 1.4% |
| Dutch | 100.0 /100 | #10 | Exceptional 1.4% |
| Lithuanians | 100.0 /100 | #11 | Exceptional 1.4% |
| Irish | 100.0 /100 | #12 | Exceptional 1.4% |
| Poles | 100.0 /100 | #13 | Exceptional 1.4% |
| Scotch-Irish | 100.0 /100 | #14 | Exceptional 1.5% |
| Tlingit-Haida | 100.0 /100 | #15 | Exceptional 1.5% |
| Finns | 100.0 /100 | #16 | Exceptional 1.5% |
| Croatians | 100.0 /100 | #17 | Exceptional 1.5% |
| Danes | 100.0 /100 | #18 | Exceptional 1.5% |