Cheyenne vs Belizean 7th Grade
COMPARE
Cheyenne
Belizean
7th Grade
7th Grade Comparison
Cheyenne
Belizeans
96.5%
7TH GRADE
94.9/ 100
METRIC RATING
121st/ 347
METRIC RANK
93.5%
7TH GRADE
0.0/ 100
METRIC RATING
321st/ 347
METRIC RANK
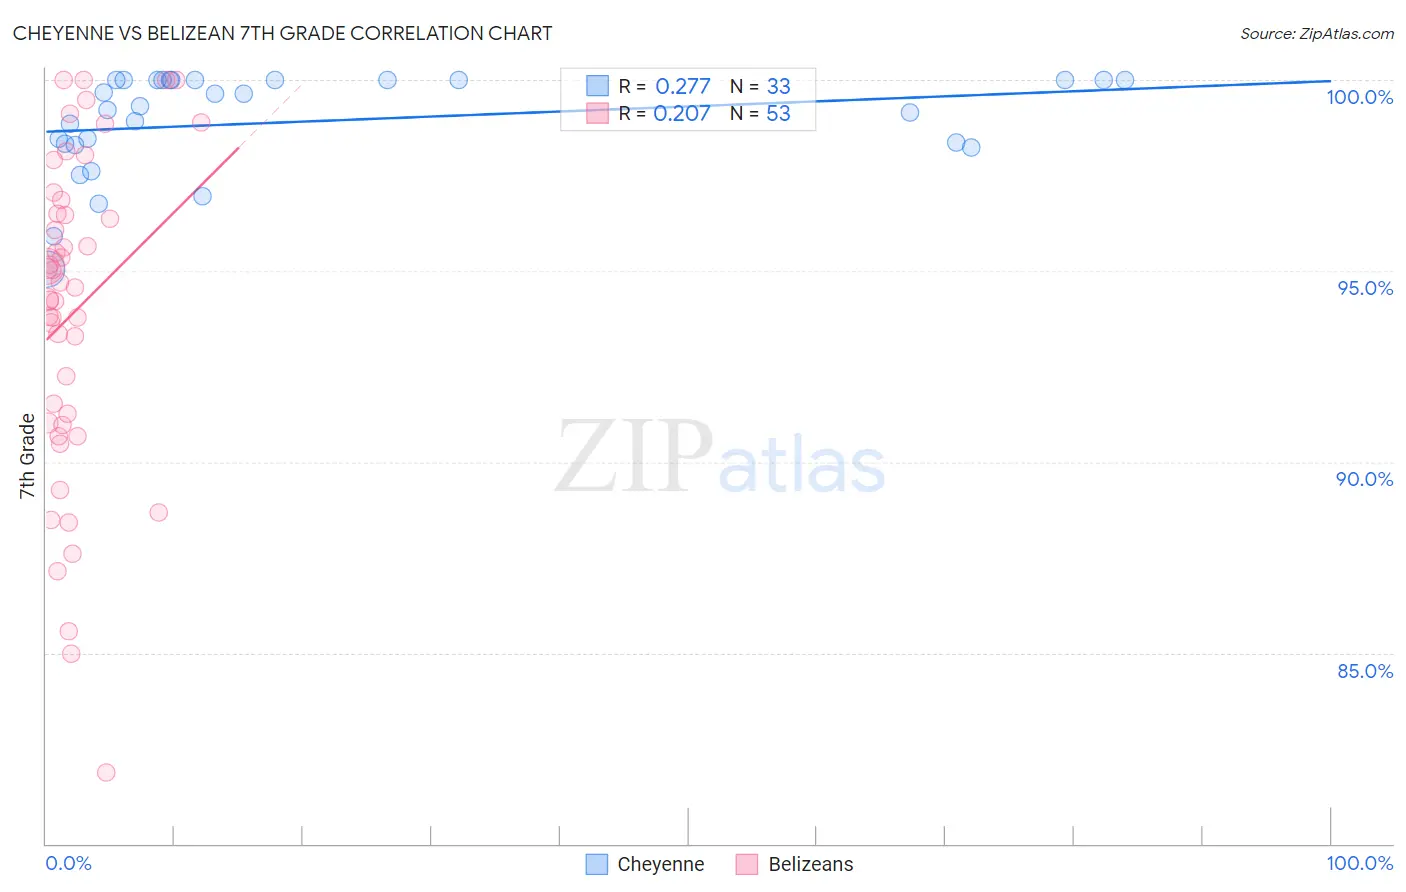
Cheyenne vs Belizean 7th Grade Correlation Chart
The statistical analysis conducted on geographies consisting of 80,716,760 people shows a weak positive correlation between the proportion of Cheyenne and percentage of population with at least 7th grade education in the United States with a correlation coefficient (R) of 0.277 and weighted average of 96.5%. Similarly, the statistical analysis conducted on geographies consisting of 144,138,333 people shows a weak positive correlation between the proportion of Belizeans and percentage of population with at least 7th grade education in the United States with a correlation coefficient (R) of 0.207 and weighted average of 93.5%, a difference of 3.2%.
7th Grade Correlation Summary
| Measurement | Cheyenne | Belizean |
| Minimum | 95.0% | 81.9% |
| Maximum | 100.0% | 100.0% |
| Range | 5.0% | 18.1% |
| Mean | 98.9% | 93.9% |
| Median | 99.3% | 94.6% |
| Interquartile 25% (IQ1) | 98.3% | 91.0% |
| Interquartile 75% (IQ3) | 100.0% | 96.7% |
| Interquartile Range (IQR) | 1.7% | 5.7% |
| Standard Deviation (Sample) | 1.3% | 4.2% |
| Standard Deviation (Population) | 1.3% | 4.2% |
Similar Demographics by 7th Grade
Demographics Similar to Cheyenne by 7th Grade
In terms of 7th grade, the demographic groups most similar to Cheyenne are Immigrants from Croatia (96.5%, a difference of 0.0%), Immigrants from Europe (96.5%, a difference of 0.0%), Immigrants from Norway (96.5%, a difference of 0.010%), Immigrants from France (96.5%, a difference of 0.010%), and Immigrants from Switzerland (96.5%, a difference of 0.010%).
| Demographics | Rating | Rank | 7th Grade |
| Immigrants | Zimbabwe | 96.6 /100 | #114 | Exceptional 96.5% |
| Choctaw | 96.6 /100 | #115 | Exceptional 96.5% |
| Syrians | 96.6 /100 | #116 | Exceptional 96.5% |
| Immigrants | Moldova | 95.7 /100 | #117 | Exceptional 96.5% |
| Immigrants | Japan | 95.5 /100 | #118 | Exceptional 96.5% |
| Immigrants | Norway | 95.2 /100 | #119 | Exceptional 96.5% |
| Immigrants | Croatia | 95.0 /100 | #120 | Exceptional 96.5% |
| Cheyenne | 94.9 /100 | #121 | Exceptional 96.5% |
| Immigrants | Europe | 94.8 /100 | #122 | Exceptional 96.5% |
| Immigrants | France | 94.7 /100 | #123 | Exceptional 96.5% |
| Immigrants | Switzerland | 94.5 /100 | #124 | Exceptional 96.5% |
| Immigrants | Bulgaria | 94.0 /100 | #125 | Exceptional 96.4% |
| Palestinians | 93.5 /100 | #126 | Exceptional 96.4% |
| Immigrants | Bosnia and Herzegovina | 93.3 /100 | #127 | Exceptional 96.4% |
| Immigrants | Romania | 93.2 /100 | #128 | Exceptional 96.4% |
Demographics Similar to Belizeans by 7th Grade
In terms of 7th grade, the demographic groups most similar to Belizeans are Immigrants from Fiji (93.5%, a difference of 0.040%), Nicaraguan (93.5%, a difference of 0.040%), Immigrants from Belize (93.4%, a difference of 0.15%), Dominican (93.3%, a difference of 0.16%), and Immigrants from Cambodia (93.7%, a difference of 0.21%).
| Demographics | Rating | Rank | 7th Grade |
| Japanese | 0.0 /100 | #314 | Tragic 94.0% |
| Vietnamese | 0.0 /100 | #315 | Tragic 93.9% |
| Immigrants | Vietnam | 0.0 /100 | #316 | Tragic 93.9% |
| Immigrants | Cuba | 0.0 /100 | #317 | Tragic 93.8% |
| Immigrants | Ecuador | 0.0 /100 | #318 | Tragic 93.7% |
| Immigrants | Cambodia | 0.0 /100 | #319 | Tragic 93.7% |
| Immigrants | Fiji | 0.0 /100 | #320 | Tragic 93.5% |
| Belizeans | 0.0 /100 | #321 | Tragic 93.5% |
| Nicaraguans | 0.0 /100 | #322 | Tragic 93.5% |
| Immigrants | Belize | 0.0 /100 | #323 | Tragic 93.4% |
| Dominicans | 0.0 /100 | #324 | Tragic 93.3% |
| Central American Indians | 0.0 /100 | #325 | Tragic 93.3% |
| Nepalese | 0.0 /100 | #326 | Tragic 93.2% |
| Immigrants | Cabo Verde | 0.0 /100 | #327 | Tragic 93.1% |
| Immigrants | Nicaragua | 0.0 /100 | #328 | Tragic 93.0% |