Immigrants from Pakistan vs Belizean 7th Grade
COMPARE
Immigrants from Pakistan
Belizean
7th Grade
7th Grade Comparison
Immigrants from Pakistan
Belizeans
95.7%
7TH GRADE
9.0/ 100
METRIC RATING
217th/ 347
METRIC RANK
93.5%
7TH GRADE
0.0/ 100
METRIC RATING
321st/ 347
METRIC RANK
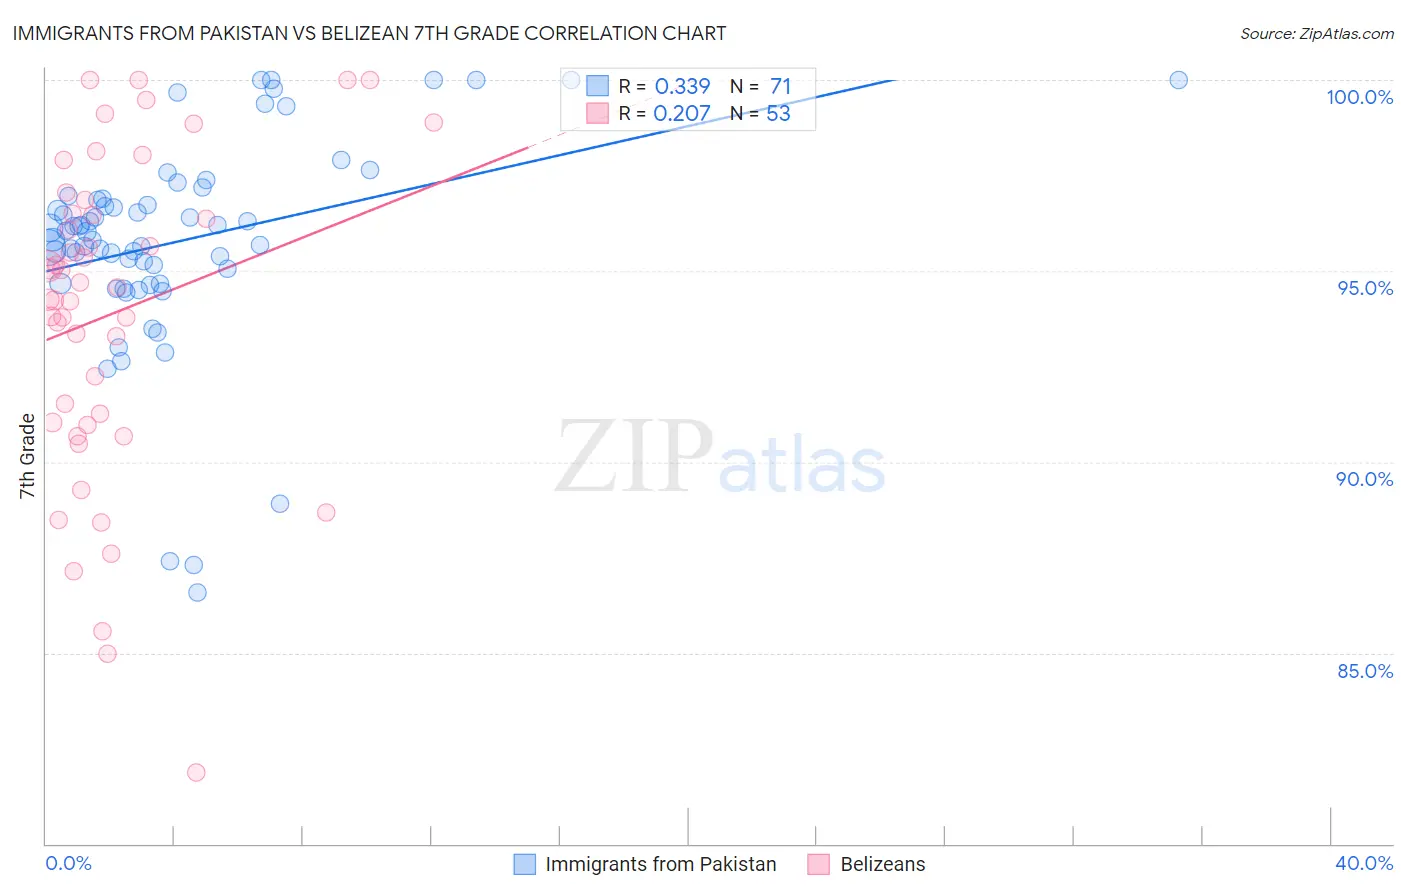
Immigrants from Pakistan vs Belizean 7th Grade Correlation Chart
The statistical analysis conducted on geographies consisting of 283,836,178 people shows a mild positive correlation between the proportion of Immigrants from Pakistan and percentage of population with at least 7th grade education in the United States with a correlation coefficient (R) of 0.339 and weighted average of 95.7%. Similarly, the statistical analysis conducted on geographies consisting of 144,138,333 people shows a weak positive correlation between the proportion of Belizeans and percentage of population with at least 7th grade education in the United States with a correlation coefficient (R) of 0.207 and weighted average of 93.5%, a difference of 2.4%.
7th Grade Correlation Summary
| Measurement | Immigrants from Pakistan | Belizean |
| Minimum | 86.6% | 81.9% |
| Maximum | 100.0% | 100.0% |
| Range | 13.4% | 18.1% |
| Mean | 95.8% | 93.9% |
| Median | 96.0% | 94.6% |
| Interquartile 25% (IQ1) | 94.7% | 91.0% |
| Interquartile 75% (IQ3) | 96.9% | 96.7% |
| Interquartile Range (IQR) | 2.2% | 5.7% |
| Standard Deviation (Sample) | 2.7% | 4.2% |
| Standard Deviation (Population) | 2.7% | 4.2% |
Similar Demographics by 7th Grade
Demographics Similar to Immigrants from Pakistan by 7th Grade
In terms of 7th grade, the demographic groups most similar to Immigrants from Pakistan are Immigrants from Chile (95.7%, a difference of 0.0%), Spanish American (95.7%, a difference of 0.010%), Immigrants from Liberia (95.7%, a difference of 0.020%), Immigrants from Southern Europe (95.7%, a difference of 0.020%), and Bahamian (95.7%, a difference of 0.040%).
| Demographics | Rating | Rank | 7th Grade |
| Hawaiians | 16.0 /100 | #210 | Poor 95.8% |
| Portuguese | 13.6 /100 | #211 | Poor 95.8% |
| Immigrants | Lebanon | 13.0 /100 | #212 | Poor 95.8% |
| Immigrants | Morocco | 12.6 /100 | #213 | Poor 95.8% |
| Bahamians | 11.6 /100 | #214 | Poor 95.7% |
| Spanish Americans | 9.3 /100 | #215 | Tragic 95.7% |
| Immigrants | Chile | 9.1 /100 | #216 | Tragic 95.7% |
| Immigrants | Pakistan | 9.0 /100 | #217 | Tragic 95.7% |
| Immigrants | Liberia | 8.1 /100 | #218 | Tragic 95.7% |
| Immigrants | Southern Europe | 7.9 /100 | #219 | Tragic 95.7% |
| Sub-Saharan Africans | 7.2 /100 | #220 | Tragic 95.7% |
| Samoans | 7.0 /100 | #221 | Tragic 95.7% |
| Laotians | 6.8 /100 | #222 | Tragic 95.7% |
| Immigrants | Syria | 6.7 /100 | #223 | Tragic 95.7% |
| Immigrants | Oceania | 6.7 /100 | #224 | Tragic 95.7% |
Demographics Similar to Belizeans by 7th Grade
In terms of 7th grade, the demographic groups most similar to Belizeans are Immigrants from Fiji (93.5%, a difference of 0.040%), Nicaraguan (93.5%, a difference of 0.040%), Immigrants from Belize (93.4%, a difference of 0.15%), Dominican (93.3%, a difference of 0.16%), and Immigrants from Cambodia (93.7%, a difference of 0.21%).
| Demographics | Rating | Rank | 7th Grade |
| Japanese | 0.0 /100 | #314 | Tragic 94.0% |
| Vietnamese | 0.0 /100 | #315 | Tragic 93.9% |
| Immigrants | Vietnam | 0.0 /100 | #316 | Tragic 93.9% |
| Immigrants | Cuba | 0.0 /100 | #317 | Tragic 93.8% |
| Immigrants | Ecuador | 0.0 /100 | #318 | Tragic 93.7% |
| Immigrants | Cambodia | 0.0 /100 | #319 | Tragic 93.7% |
| Immigrants | Fiji | 0.0 /100 | #320 | Tragic 93.5% |
| Belizeans | 0.0 /100 | #321 | Tragic 93.5% |
| Nicaraguans | 0.0 /100 | #322 | Tragic 93.5% |
| Immigrants | Belize | 0.0 /100 | #323 | Tragic 93.4% |
| Dominicans | 0.0 /100 | #324 | Tragic 93.3% |
| Central American Indians | 0.0 /100 | #325 | Tragic 93.3% |
| Nepalese | 0.0 /100 | #326 | Tragic 93.2% |
| Immigrants | Cabo Verde | 0.0 /100 | #327 | Tragic 93.1% |
| Immigrants | Nicaragua | 0.0 /100 | #328 | Tragic 93.0% |