Guyanese vs Samoan Master's Degree
COMPARE
Guyanese
Samoan
Master's Degree
Master's Degree Comparison
Guyanese
Samoans
13.7%
MASTER'S DEGREE
7.6/ 100
METRIC RATING
231st/ 347
METRIC RANK
11.5%
MASTER'S DEGREE
0.1/ 100
METRIC RATING
298th/ 347
METRIC RANK
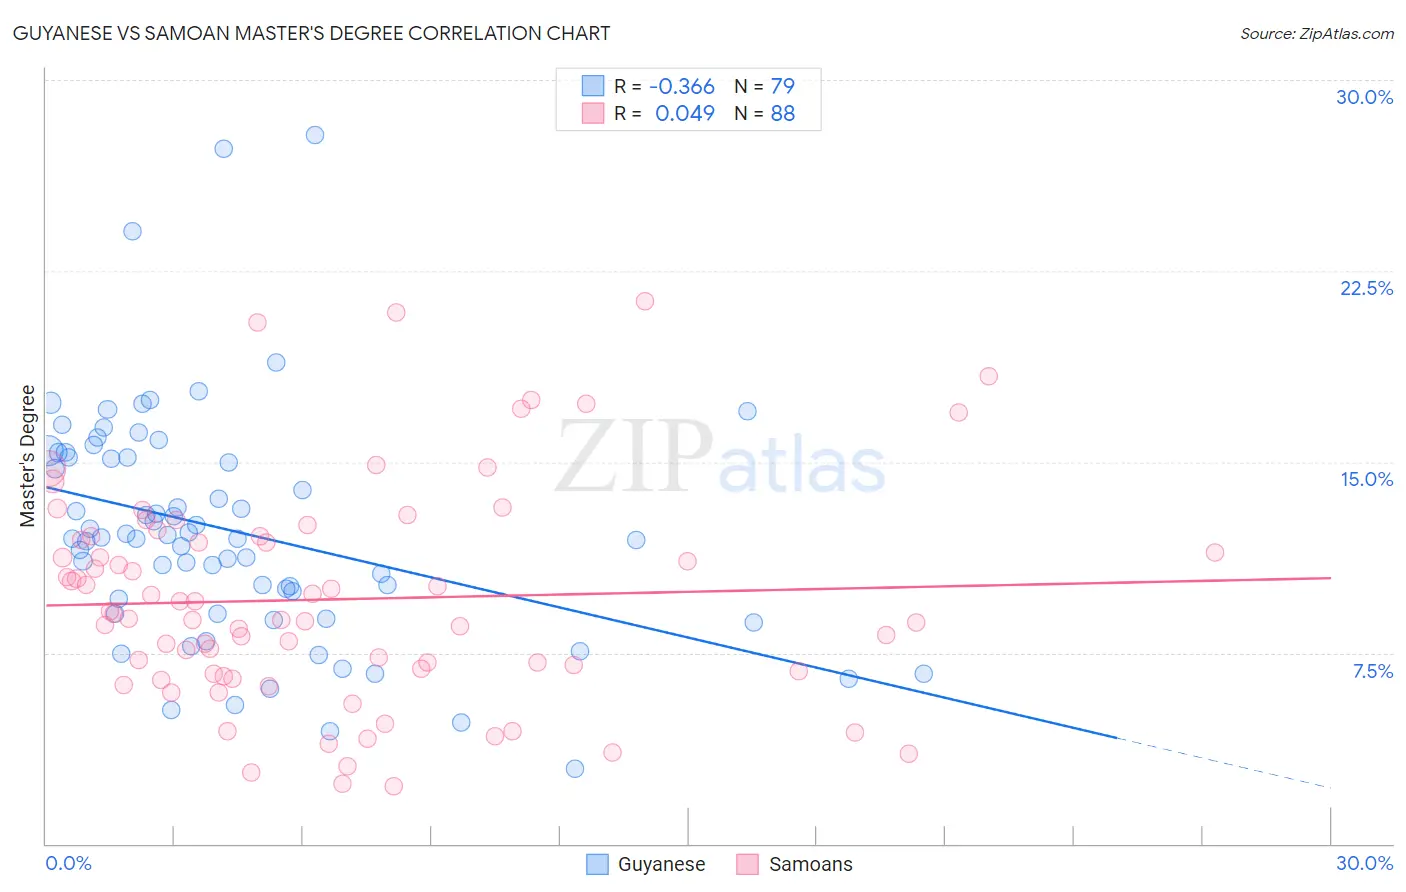
Guyanese vs Samoan Master's Degree Correlation Chart
The statistical analysis conducted on geographies consisting of 176,878,343 people shows a mild negative correlation between the proportion of Guyanese and percentage of population with at least master's degree education in the United States with a correlation coefficient (R) of -0.366 and weighted average of 13.7%. Similarly, the statistical analysis conducted on geographies consisting of 225,135,673 people shows no correlation between the proportion of Samoans and percentage of population with at least master's degree education in the United States with a correlation coefficient (R) of 0.049 and weighted average of 11.5%, a difference of 19.6%.
Master's Degree Correlation Summary
| Measurement | Guyanese | Samoan |
| Minimum | 3.0% | 2.3% |
| Maximum | 27.9% | 21.3% |
| Range | 24.9% | 19.0% |
| Mean | 12.3% | 9.6% |
| Median | 12.0% | 8.9% |
| Interquartile 25% (IQ1) | 9.0% | 6.7% |
| Interquartile 75% (IQ3) | 15.2% | 12.0% |
| Interquartile Range (IQR) | 6.2% | 5.3% |
| Standard Deviation (Sample) | 4.6% | 4.2% |
| Standard Deviation (Population) | 4.6% | 4.2% |
Similar Demographics by Master's Degree
Demographics Similar to Guyanese by Master's Degree
In terms of master's degree, the demographic groups most similar to Guyanese are Dutch (13.8%, a difference of 0.55%), British West Indian (13.8%, a difference of 0.58%), White/Caucasian (13.8%, a difference of 0.68%), Immigrants from Philippines (13.6%, a difference of 0.88%), and Immigrants from West Indies (13.9%, a difference of 1.0%).
| Demographics | Rating | Rank | Master's Degree |
| Immigrants | Grenada | 11.8 /100 | #224 | Poor 14.0% |
| Portuguese | 11.2 /100 | #225 | Poor 13.9% |
| Immigrants | St. Vincent and the Grenadines | 11.0 /100 | #226 | Poor 13.9% |
| Immigrants | West Indies | 9.8 /100 | #227 | Tragic 13.9% |
| Whites/Caucasians | 9.1 /100 | #228 | Tragic 13.8% |
| British West Indians | 8.8 /100 | #229 | Tragic 13.8% |
| Dutch | 8.7 /100 | #230 | Tragic 13.8% |
| Guyanese | 7.6 /100 | #231 | Tragic 13.7% |
| Immigrants | Philippines | 6.0 /100 | #232 | Tragic 13.6% |
| Immigrants | Ecuador | 5.7 /100 | #233 | Tragic 13.6% |
| Immigrants | Burma/Myanmar | 5.0 /100 | #234 | Tragic 13.5% |
| German Russians | 4.5 /100 | #235 | Tragic 13.5% |
| Immigrants | Guyana | 4.4 /100 | #236 | Tragic 13.4% |
| Jamaicans | 4.1 /100 | #237 | Tragic 13.4% |
| Hmong | 4.0 /100 | #238 | Tragic 13.4% |
Demographics Similar to Samoans by Master's Degree
In terms of master's degree, the demographic groups most similar to Samoans are Chickasaw (11.4%, a difference of 0.46%), Chippewa (11.4%, a difference of 0.48%), Tsimshian (11.4%, a difference of 0.64%), Immigrants from Yemen (11.6%, a difference of 0.71%), and Marshallese (11.6%, a difference of 0.84%).
| Demographics | Rating | Rank | Master's Degree |
| Colville | 0.1 /100 | #291 | Tragic 11.6% |
| Immigrants | Guatemala | 0.1 /100 | #292 | Tragic 11.6% |
| Alaska Natives | 0.1 /100 | #293 | Tragic 11.6% |
| Hawaiians | 0.1 /100 | #294 | Tragic 11.6% |
| Marshallese | 0.1 /100 | #295 | Tragic 11.6% |
| Alaskan Athabascans | 0.1 /100 | #296 | Tragic 11.6% |
| Immigrants | Yemen | 0.1 /100 | #297 | Tragic 11.6% |
| Samoans | 0.1 /100 | #298 | Tragic 11.5% |
| Chickasaw | 0.1 /100 | #299 | Tragic 11.4% |
| Chippewa | 0.1 /100 | #300 | Tragic 11.4% |
| Tsimshian | 0.1 /100 | #301 | Tragic 11.4% |
| Cherokee | 0.1 /100 | #302 | Tragic 11.4% |
| Immigrants | Laos | 0.1 /100 | #303 | Tragic 11.4% |
| Immigrants | Cabo Verde | 0.1 /100 | #304 | Tragic 11.3% |
| Immigrants | Latin America | 0.0 /100 | #305 | Tragic 11.3% |