Guyanese vs Carpatho Rusyn Master's Degree
COMPARE
Guyanese
Carpatho Rusyn
Master's Degree
Master's Degree Comparison
Guyanese
Carpatho Rusyns
13.7%
MASTER'S DEGREE
7.6/ 100
METRIC RATING
231st/ 347
METRIC RANK
17.5%
MASTER'S DEGREE
99.6/ 100
METRIC RATING
80th/ 347
METRIC RANK
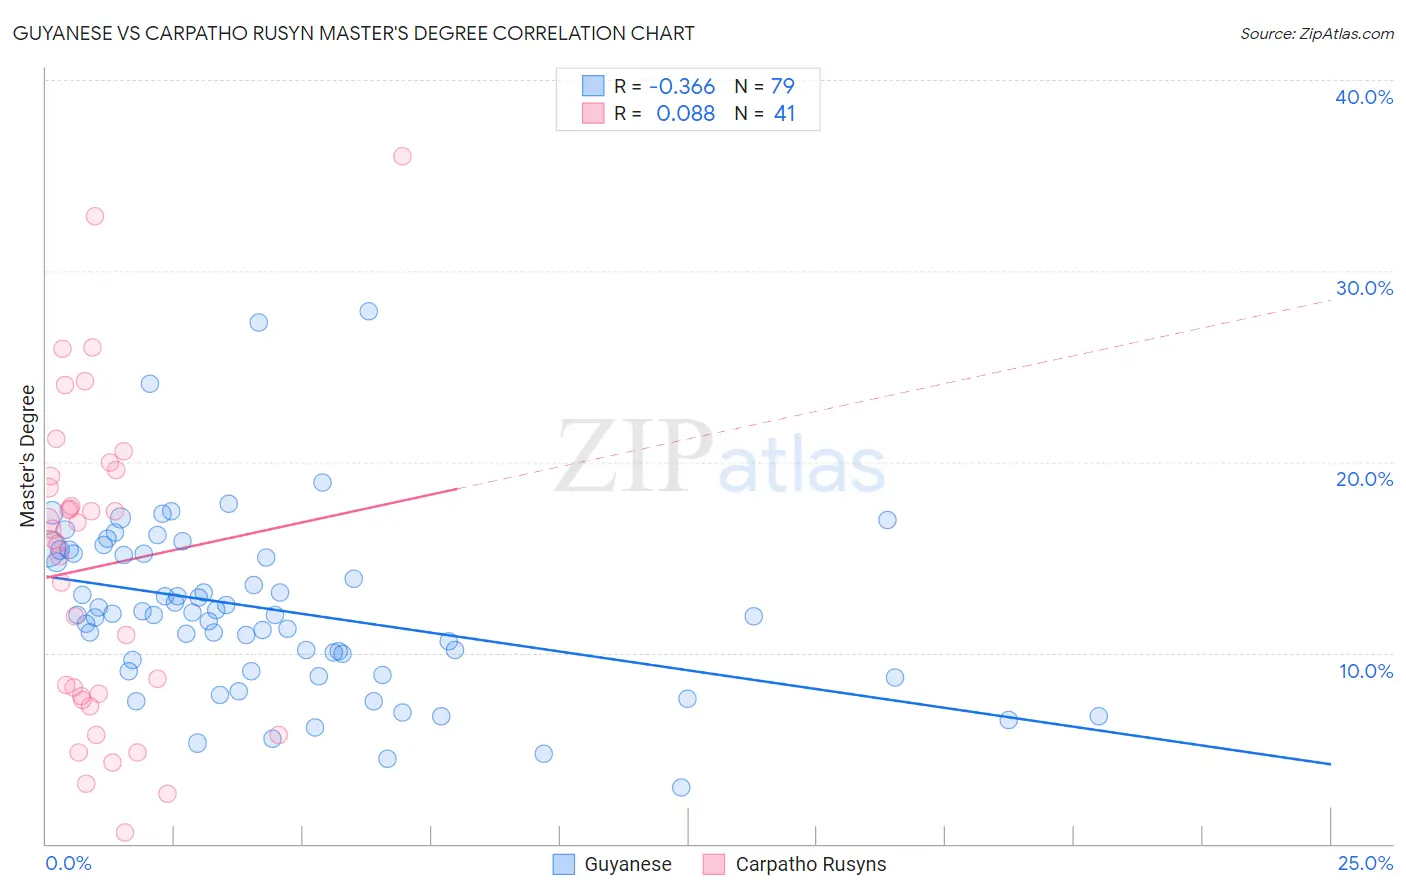
Guyanese vs Carpatho Rusyn Master's Degree Correlation Chart
The statistical analysis conducted on geographies consisting of 176,878,343 people shows a mild negative correlation between the proportion of Guyanese and percentage of population with at least master's degree education in the United States with a correlation coefficient (R) of -0.366 and weighted average of 13.7%. Similarly, the statistical analysis conducted on geographies consisting of 58,870,133 people shows a slight positive correlation between the proportion of Carpatho Rusyns and percentage of population with at least master's degree education in the United States with a correlation coefficient (R) of 0.088 and weighted average of 17.5%, a difference of 27.6%.
Master's Degree Correlation Summary
| Measurement | Guyanese | Carpatho Rusyn |
| Minimum | 3.0% | 0.58% |
| Maximum | 27.9% | 36.0% |
| Range | 24.9% | 35.4% |
| Mean | 12.3% | 14.5% |
| Median | 12.0% | 15.9% |
| Interquartile 25% (IQ1) | 9.0% | 7.6% |
| Interquartile 75% (IQ3) | 15.2% | 19.4% |
| Interquartile Range (IQR) | 6.2% | 11.8% |
| Standard Deviation (Sample) | 4.6% | 8.3% |
| Standard Deviation (Population) | 4.6% | 8.2% |
Similar Demographics by Master's Degree
Demographics Similar to Guyanese by Master's Degree
In terms of master's degree, the demographic groups most similar to Guyanese are Dutch (13.8%, a difference of 0.55%), British West Indian (13.8%, a difference of 0.58%), White/Caucasian (13.8%, a difference of 0.68%), Immigrants from Philippines (13.6%, a difference of 0.88%), and Immigrants from West Indies (13.9%, a difference of 1.0%).
| Demographics | Rating | Rank | Master's Degree |
| Immigrants | Grenada | 11.8 /100 | #224 | Poor 14.0% |
| Portuguese | 11.2 /100 | #225 | Poor 13.9% |
| Immigrants | St. Vincent and the Grenadines | 11.0 /100 | #226 | Poor 13.9% |
| Immigrants | West Indies | 9.8 /100 | #227 | Tragic 13.9% |
| Whites/Caucasians | 9.1 /100 | #228 | Tragic 13.8% |
| British West Indians | 8.8 /100 | #229 | Tragic 13.8% |
| Dutch | 8.7 /100 | #230 | Tragic 13.8% |
| Guyanese | 7.6 /100 | #231 | Tragic 13.7% |
| Immigrants | Philippines | 6.0 /100 | #232 | Tragic 13.6% |
| Immigrants | Ecuador | 5.7 /100 | #233 | Tragic 13.6% |
| Immigrants | Burma/Myanmar | 5.0 /100 | #234 | Tragic 13.5% |
| German Russians | 4.5 /100 | #235 | Tragic 13.5% |
| Immigrants | Guyana | 4.4 /100 | #236 | Tragic 13.4% |
| Jamaicans | 4.1 /100 | #237 | Tragic 13.4% |
| Hmong | 4.0 /100 | #238 | Tragic 13.4% |
Demographics Similar to Carpatho Rusyns by Master's Degree
In terms of master's degree, the demographic groups most similar to Carpatho Rusyns are Immigrants from Lebanon (17.5%, a difference of 0.050%), Immigrants from Hungary (17.5%, a difference of 0.19%), Immigrants from Western Asia (17.5%, a difference of 0.30%), Greek (17.5%, a difference of 0.35%), and Immigrants from Eastern Europe (17.6%, a difference of 0.38%).
| Demographics | Rating | Rank | Master's Degree |
| Zimbabweans | 99.7 /100 | #73 | Exceptional 17.7% |
| Immigrants | Romania | 99.7 /100 | #74 | Exceptional 17.7% |
| Egyptians | 99.6 /100 | #75 | Exceptional 17.6% |
| Immigrants | Indonesia | 99.6 /100 | #76 | Exceptional 17.6% |
| Immigrants | Eastern Europe | 99.6 /100 | #77 | Exceptional 17.6% |
| Immigrants | Hungary | 99.6 /100 | #78 | Exceptional 17.5% |
| Immigrants | Lebanon | 99.6 /100 | #79 | Exceptional 17.5% |
| Carpatho Rusyns | 99.6 /100 | #80 | Exceptional 17.5% |
| Immigrants | Western Asia | 99.5 /100 | #81 | Exceptional 17.5% |
| Greeks | 99.5 /100 | #82 | Exceptional 17.5% |
| Immigrants | Zimbabwe | 99.5 /100 | #83 | Exceptional 17.4% |
| Immigrants | Scotland | 99.4 /100 | #84 | Exceptional 17.4% |
| Immigrants | Brazil | 99.4 /100 | #85 | Exceptional 17.4% |
| Immigrants | Croatia | 99.3 /100 | #86 | Exceptional 17.3% |
| Maltese | 99.3 /100 | #87 | Exceptional 17.3% |